
IMPORTANT: this is an old demo of this tool. To watch the NEW demo of Shopkeeper go here: https://orangeklik.com/demo-shopkeeper-2019/
Shopkeeper (formerly known as AMZPing) is an easy to use software, which shows Amazon sales and inventory data across all marketplaces in one place. Meet Paulina Masson – the founder and creator of SHOPKEEPER.
List of features and topics covered in this video:
00:59 Introduction to the presentation
01:23 The information seen on the Shopkeeper‘s dashboard and how to use it to analyse your business
01:38 Trends section of the app – what does it show and what you can learn from it about your sales
02:38 Pulling the sales for the specific time period
03:48 Sales dashboard – analysing why seller made less profit this month than usual
04:22 “Hide my Product information” button – handy for taking screenshots and sharing them publicly without revealing product data
05:08 “Sales” main table – the data columns
05:18 How it is possible that a product which sold 0 units made $16 profit?
06:06 Activating additional details on the sales main table
06:37 “Margin” data column on the sales dashboard.
07:27 How to find out why certain product made lower margin profit than expected.
09:03 What marketplaces are covered by the application?
09:24 Shopkeeper automatically converts report data from the currency of different Amazon marketplaces into the currency chosen in your settings.
10:20 How to change the web app currency for all the pages.
11:20 Pulling combined data of overall transactions for all different Amazon marketplaces
12:08 Sales dashboard takes all the sales related taxes into consideration (European VAT, Mexican VAT, US Sales Tax, Japan etc). Adjusting the tax information per country manually.
14:52 How to analyse why I make a low margin on certain products?
16:06 Fetching data about one particular order
16:40 How to check how much money you loose on product returns by the customers. Product refund analysis.
18:51 Overview of different widgets on the main dashboard: top product sellers, 1 day profit record, etc
19:28 Inventory Management feature overview
19:42 “Inventory” widget on the main dashboard
21:05 How can you manage your inventory using Shopkeeper?
21:32 Analysing and planning your inventory
23:27 How many units to reorder?
24:27 What are the high season months for the specific product?
25:57 Getting the details on how the “number of units to be reordered” was calculated.0
26:53 How Shopkeeper helps to forecast the date of when your next inventory order should take place
28:58 How adding specific keywords to the internal product description can speed up searching needed items in the future
30:22 “To Do List” feature
30:44 “Sellers” section – Hijacker monitoring for your listings
31:05 “Resources” section: Influencers, tools, links to the extensive Amazon selling “how to” guides
31:55 Demonstration how Shopkeeper gets connected to the Amazon seller account
33:02 How long does it take to fetch the initial sales data from the Amazon servers
34:08 What kind of sellers are the best fit for Shopkeeper application?
35:02 Pricing overview
35:47 What features are planed in the near future?
36:20 Upcoming feature: Multiple seller accounts
36:36 Upcoming feature: Inventory management expansion: managing local inventory, its logistics, storage between the warehouses, etc
36:54 Upcoming feature: Storage Fees: which item, what fees, long-term storage, monthly storage, etc
37:40 Support – what’s the best way to solve the issues as Shopkeeper user?
38:43 US Sales tax – how is it shown on the Shopkeeper application?
38:43 Offer: no coupon code this time, but use “Demo Mondays” link https://demomondays.com/shopkeeper and get an extended 45 days trial (instead of 14 days)
Transcript – Walk-through of Shopkeeper
[00:00] Augustas: Hi everyone, welcome to another session of Demo Mondays. Demo Mondays is a video series where I invite creators and founders of Amazon seller software and tools to present their products. And today our guest is Shopkeeper.
[00:25] Augustas: And Shopkeeper is presented by its founder, Paulina. Hello Paulina!
[00:25] Paulina: Hi Augustas. How are you?
[00:29] Augustas: Everything is all right. And we will not stretch the time, so we’ll go directly to the presentation. But before that, could you briefly tell us what Shopkeeper
is about? What does it do?
[00:44] Paulina: Sure. Shopkeeper
does two things. First, it helps you to see how much money you’re actually making. And second, it helps you to manage your inventory. That’s the two basic things.
[00:56] Augustas: Alright. Let’s do the presentation.
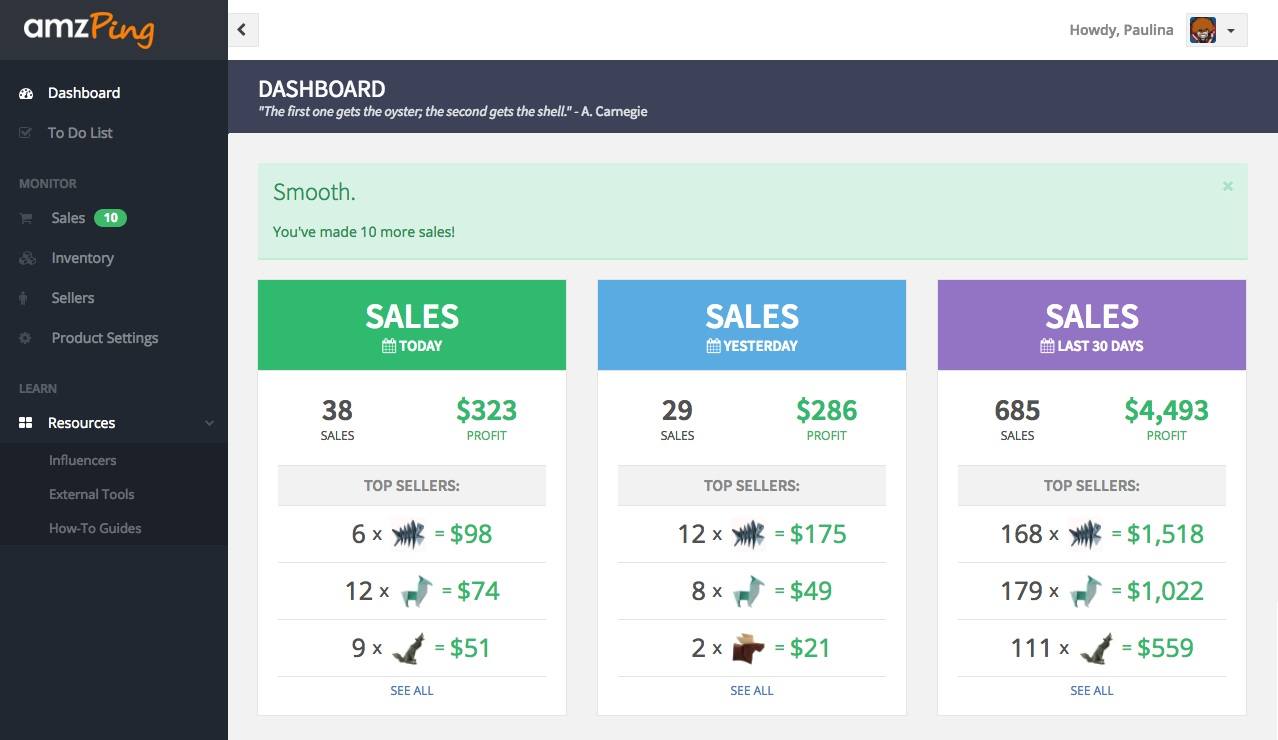
[01:00] Paulina: OK. So I decided, for this demo, that I will basically show you how I personally use the app. I’m an Amazon seller. I’m a small fish — I’m a very tiny fish. But I do have Amazon sales in all my marketplaces. And I thought that for you to see the real data, it will be much more interesting. And I will show you how an Amazon seller can use it. Every day, I come to the Dashboard and I see how many sales I made today. So there’s the widget for “Today.” I see that so far, I made 10 sales and I made $83 in profit — so it isn’t that bad for me so far. But I look at yesterday and I see that I only made 9 sales yesterday, which is very low for my normal standards. So I get a little bit worried and I go to investigate why is that exactly 9 sales only.
[01:57] Paulina: So I’ll go to “Trends”, and here it shows my number of units sold month by month by month. I will switch that to “Day By Day” and I will choose the last 30 days. So now, I can see that on October 29th, the sales were only 9 units, even though the days before it was 13, 19, 25, 21. So it was an average 20 units a day sales. But for some reason, on October 29th, it was only 9 units. So this worries me. I actually went to Amazon Seller Central and checked if my account was suspended, but nothing like that happened. So to investigate a little more, what I did is I went to “Custom Range” here. And let me enter a different date. So I wanted to check the exact same period last year. So this is from the last year and I will just check until November 1st.
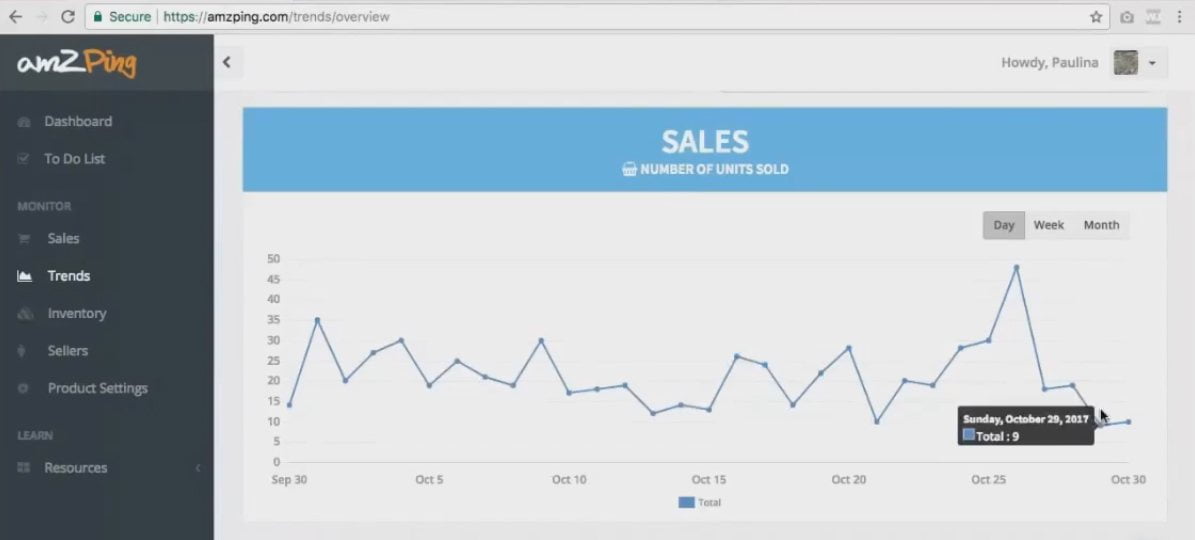
[03:07] Paulina: Basically, the same range last year and I see that the sales were up the days before and exactly down again on October 29th. So this made me feel a little better because I see that both years on October 29th, for some mystical reason, my sales were low — and then they just continued to rise onwards because Christmas is coming and they rise again slowly. So it must be seasonal reasons. In fact, I do sell Halloween products, so there was a peak and then it ended. Probably, everybody’s celebrating Halloween and nobody’s buying my product. Let’s go back to the Dashboard. I would look at the last 30 days and I made $4,000 in profit. Again, this is a little bit lower than I am used to seeing — I usually make about $5,000 in profit. So what would I do to to check it out?
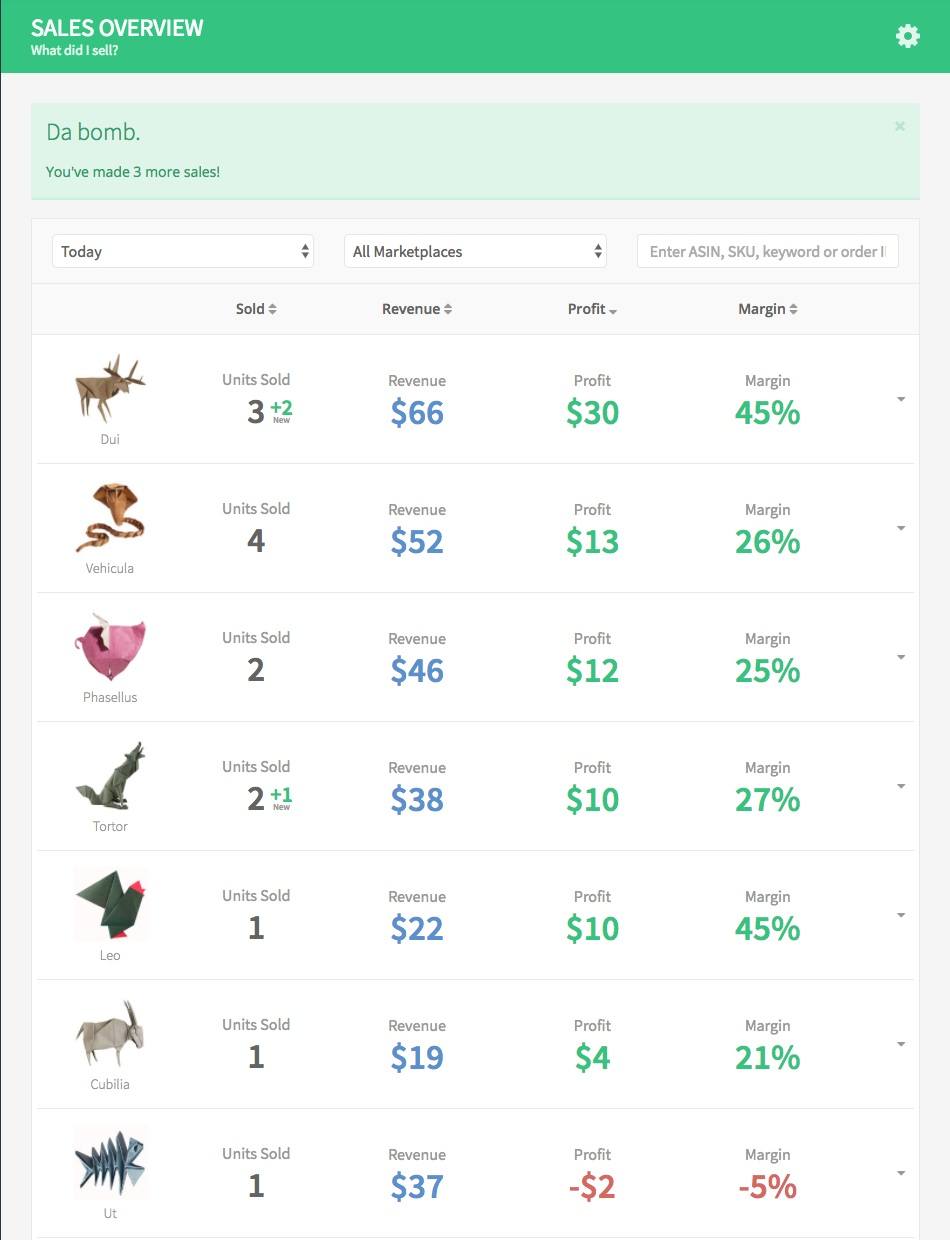
[04:05] Paulina: Why exactly I made $1,000 less? I either click on the widget or I can go directly to the “Sales” page. So I click on the widget and investigate. Now it shows me for the last 30 days all the items and products that I have, row by row, and you probably noticed the origami and now thinking what products am I selling. This is a feature that we offer in Shopkeeper. If you want to demo the product or to take screenshots of the app, there is a very handy button here at the bottom of any page and it says “Hide My Product Information.” So it obscures all your sensitive product information like the title, the ASINs, and the links. Even the title text, as you can see, is in Latin. You can use this feature as well when you are showing the app to your friends.

[04:58] Paulina: So that’s why you will be looking at origami today. But of course, these are my actual sales and actual products hiding behind it. To analyze, the whole page is sorted by the “Profit” column. So you will see that this purple squirrel made $947 in profit. And the least was by the rooster, which is actually out of stock at the moment. It has zero units sold, but for some reason, it has $16. So how is it possible that the rooster who sold zero units actually made $16 in profit? This must be a mistake. So what I would do is I would expand the row and click on the “Details.” And I will see that there was actually an “Inventory Reimbursement” from Amazon. Some customer probably returned the refunded item and when the item was restocked by Amazon, they do give us an inventory reimbursement
and it appeared in the last 30 days. That’s why it’s on this list.
[06:04] Paulina: All right, so what else? Now I’m looking at all the numbers of the profit and it’s really hard to tell. This one made the most, but does it use the full potential of the product that it could? So to see if it uses the full potential, we have additional options here. Some people like to see the screen very simply like this, but there are many other things that you can turn on to have a little bit of additional data. So I will turn on some of the things here for us to see. Now, you see there is a “Margin” column. This is a very useful column to have when you want to analyze how your products are doing. I will sort by the Margin and immediately, you see that actually the best product to focus on is the seal — not the purple squirrel — because it has 47 percent of margin right now, which is very good. And I will scroll down to look how everything is doing and look for the reason why I’m making $1,000 less a month, and I see that this fish skeleton here, it’s actually making only 14 percent in margin.
[07:16] Paulina: This is pretty bad for this product. Usually, I aim to have about 35 to 40 percent margin because all my products are private-label products. So to see exactly what happened here, why it’s only 14 percent, I would expand this row and it will show me, for each country, what margin it’s doing. So in Japan, its 38 percent. In Canada, 27, and it goes into decreasing rate, and look what’s happening. France is already losing money, and in the end, the UK. Wow. This is a lot of loss, right? So I see that actually only one unit was sold but it lost -$86. So there, that’s where all my profit is being eaten up by something here. Now to check what exactly is making this negative, we will click on the “Details.” And I will see that at the end here, I have actually PPC cost that is very high.
[08:16] Paulina: I skipped everything here on purpose — I’ll come back to it later. So I see that PPC cost is £77, and if I did not have this PPC cost, I would make about £22 profit. That means the reason is PPC. So after looking at this, I will look at this one as well, and there you see again, PPC cost is crazy high. So that’s my reason. There you go, I found it. After this, I would go to either one of the apps I’m using for PPC management or directly to Amazon Seller Central and go to Advertising Campaign manager, and I would optimize my PPC to try and make this into a positive profit.
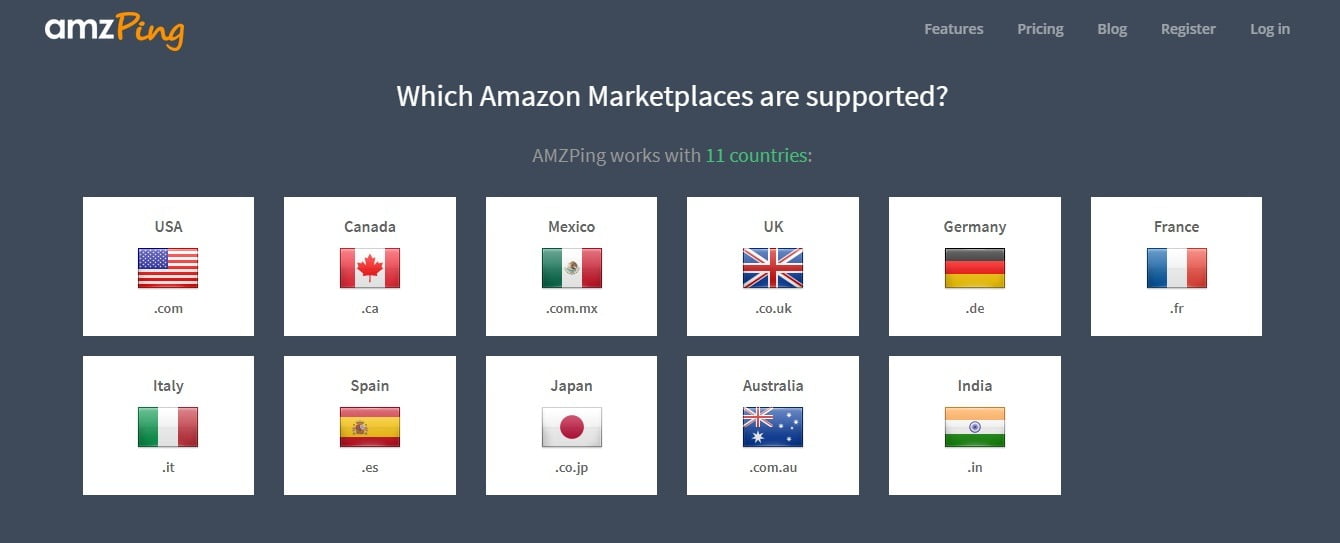
[09:08] Augustas: Paulina, as I see from your app, it covers a lot of different marketplaces. Can you briefly tell which marketplaces are covered by your app?
[09:13] Paulina: Yes. So we cover 10 different marketplaces. So these being all the North American region, all the European region, plus India and Japan. You will see that I’m selling everywhere, except India. So I have sales in each of these countries. What is very convenient here is we are converting the local currency sales, because Amazon will show you the sales in local currency. For example, in Mexico. So two units [sold] and it will show you 838 Mexican dollars, right? You don’t know how much that is, but we’ll conveniently show you that that is $44, and in Japanese yen and Canadian dollars and so on. So this becomes very, very handy to compare the rows to each other. So instead of having to compare Japanese yen to Canadian dollars, I can quickly compare that Canada is doing a little bit better than Japan just because I can see this comparison.
[10:10] Paulina: So it lets me, very quickly with one glance, judge what is doing good and what is doing bad. This is a very useful feature to have. Just to add to this, there is an option to also change the currency in which you see everything. So for example, if you go to your settings and you’re from Germany, you would like to see everything in euros. You can update it and the whole app will now start showing you amounts in euros. So if you’ll go back to the same page, you’ll see everything here in euros. Whatever your eye is mostly used to seeing, then it makes it very easy to judge without analyzing the data too much. This was the problem that I had when I was using the other apps. They have very spreadsheet-like format — when you have to sit, look, analyze and think what they’re showing and how much you are making. On here, you can quickly judge which one is making me lose my money. That’s why I created the app, to have all the marketplaces information combined into one.

[11:20] Paulina: Alright, so to continue with this, let’s look at some other things. For example, for the last six months. So the last six months gives me a very good information. I could expand the details in the “Totals” row and you would see a lot of detail about all the transactions that happened during those last six months. You could provide this to your accountant. It even shows you “Collected Sales Tax” amount for a custom period selected. And then you can see the reimbursements from Amazon, the adjustments and the total profits. So it’s a nice total spreadsheet and overview of what happened in your selected period.

[11:20] Augustas: You mentioned that there is a Sales Tax information. Is it VAT tax in Europe or are you talking about US sales tax?
[12:24] Paulina: It is any tax collected anywhere. If you go to “Product Settings” and let’s say one of the items that I’m selling is a skeleton fish and I sell it in every marketplace that exists, except India — because it’s so hard to sell there — you will see that for every country, when you are setting up your expenses and costs, we have a field which is your “Collected Sales Tax Rates.” So for example, if you’re collecting sales tax in Mexico, you would enable this feature. And then we automatically deduct that. If you’re asking about the VAT, for example, in United Kingdom, I am selling this item and I collect 20 percent VAT, so I enable this feature and then the app automatically calculates the VAT for you. Same with the other countries. I am actually a seller who sends everything from UK, so I do not use the Pan-European. That’s why my tax rate in all the countries is 20 percent. If I will be using the Pan-European, I will put in here the appropriate one. I forgot what it is, if it’s 22 or 19 or 21 for Germany.
[13:43] Paulina: So if it’s 19, then it would be 19 percent if I would be storing any items in Europe. So you have the flexibility to change to whatever is your setting here. And then at the end, when you set that up, just like you saw in the spreadsheet, it will actually show what’s the amount for Collected Sales Tax. This is very handy for you to know when you are getting ready to pay it, so you’ll know how much cash to prepare in your bank account.
[14:21] Augustas: I think it’s very different from many other apps. They rarely take into account the European tax so sellers cannot know what exactly is their profit.
[14:32] Paulina: Exactly. And there is tax in Mexico as well, and in Japan as well. So this is a very useful feature to have. Otherwise, if you are not subtracting your Collected Sales Tax, your profit will be bloated and you would not know exactly how much money you’re going to make. You always would have to guess how much the tax is inside of it. One more thing I wanted to show you — let’s go back to the last six months, how I would look at it. So let’s say, if I’m looking at this item here and analyze it and I see that Canada only has 11 percent on this cobra [snake] item here. Now I would like to see again if PPC is the reason why I’m making such a low margin. So I will expand the details and I will check the PPC quickly.
[15:19] Paulina: I see that it’s only 3.50 Canadian dollars and that is the PPC spend. So it must not be the reason because the revenue was $400. So there must be some other reason why it has only 11 percent margin. The reason is there is one refund, and suddenly on the right side of this, there are many different numbers entered here. To explain this a little bit better, on the left side is everything that is related to orders and sales. And on the right side is everything related to refunds. So we can look at one single refund and I will in detail how you can analyze that. So I entered a specific order number here and now it’s going to Amazon and fetching the data about this particular order. As you’ll notice here, this order was actually refunded — one unit sold and one refund. And in “Total”, when it added up all the information, it was -5 euros. When it’s done fetching, I will see the details. Let me just open it here.
[16:36] Paulina: So this is a very recent feature that we added only a week ago. So now, I would like to go and explain to you exactly how to check how much money you are losing when one refund comes. So for this cobra item, the item price is 11.37 euros. So when the refund came in, Amazon actually took back the money from me. So Amazon gave me the money when the order came, and took it back from me when the order was refunded. Then for Amazon fees, Amazon did not give me back money for FBA fees and did not also give back for Sales Tax Collection fees. So this is actually my cost on the refund — these two things. The other things were returned. So the AMZPing
puts back the “Cost of Goods” for you because the item returned to the inventory. So you will resell it again.
[17:30] Paulina: And one more thing that appeared here is “Refund Administration Fee”, which is 30 cents in euros. In total, when you look at it, this item made that amount of money in profit when it was sold, so it’s a very low profit margin already. But because the refund came, this refund subtracted that much. So in the end, every refund is costing me 4 euros and 59 cents. Whenever a person refunds something, that means that I have to sell at least four units of this product to cover for this one refund. So four units of a product to one is 25 percent, so I better target my refund rate to be lower than 25 percent if I want to keep making money. And in fact, Amazon will send you a notification if you are higher than 10 or 15 percent refund rate. They will even suspend your listing if that happens.
[18:22] Paulina: So this is a good indicator for you to know how much exactly one refund is costing you. So in my case, this was 5 euros. So I hope that was a pretty clear explanation about refunds. This is how I use it. And that pretty much covers the basics of how I use it. There are many other details which I will not get into, but you can understand already how it all works. There are some nice interesting widgets as well related to sales — things you can explore yourself here, but I will quickly show you a few. For example, you can see the “Top Sellers” in the last 30 days. You see that this green llama is my top seller — it’s my favorite one. You can also see that the “Record Profit in One Day” was last year, just before Christmas, and they made 963 euros in one day.
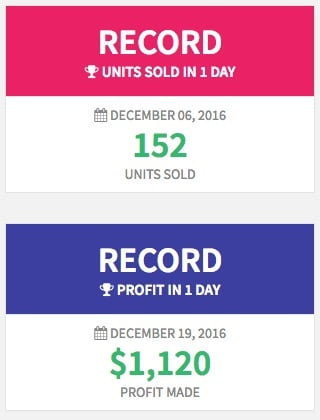
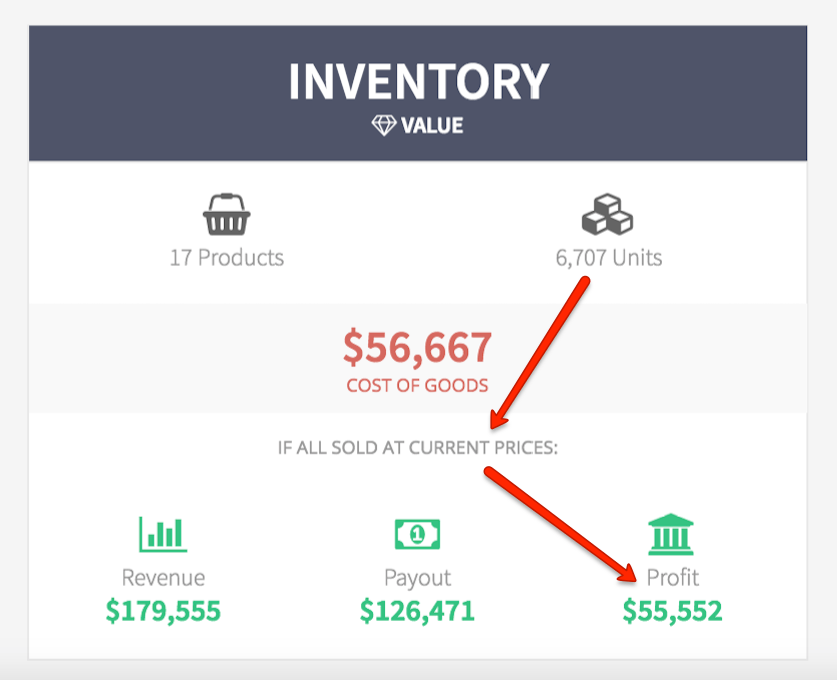
[19:18] Paulina: That was my favorite day last year, and I’m hoping that this year will be similar. So you can explore the widgets and see what you can find here. I wanted to tell you another important feature that AMZPing covers. It actually helps you to manage your inventory, which is an important thing when you’re trying to control your cash flow as an Amazon seller. So on the Dashboard, you will find the widget which is called “Inventory Value.” You will see that I have 11 products and they have 8,556 units in total that are already stocked at Amazon or I have them available. For that, I spent 60,000 euros — that includes shipping, manufacturing, import costs, import taxes, all the other fees related to acquiring the goods. So I’ve already invested that much and that’s already available for sale.
[20:17] Paulina: So if now I suddenly decided that from today, I am not expanding my business anymore, I want to cash out from Amazon business. If I want to cash out, I will wait about one year, in my estimation, before everything will sell. In that one year, I will get a payout of 137,000 euros, and out of that, 63,000 euros will be actual profit. But if I want to cash out today and I make a decision, I can see how much money I will be potentially getting from my business. It’s a really nice widget to have. When you sign up for our app, you can go and head here first and check what the numbers are for you, so you will get a feeling if you’re rich or not — and you’re probably much more rich than I am because I’m just a small seller here. Alright, so how do I manage the inventory? On the left, you will see I have this Inventory page, so let’s go there. And here, the columns look like that.
[21:16] Paulina: There is how many units you have available, how many it’s selling a day, and then how long it’s good for. For example, this one has 36 units available in Canada. It’s selling less than one a day and it’s good for four months. I will start working on that. I will show you how I usually do it. So I start marketplace by marketplace, then I click on “United States” and I will sort everything by “Good For”. So I can see that the lowest Good For month is zero. And you see, I already took care of these three because you see here, 229 on the way, so I already placed an order and managed that one already. Here, 177 on the way, and here, 40 on the way. The next one to work on is this one. It’s only one unit left, a cobra snake, and I am in a very bad situation because I’m already ordering too late.
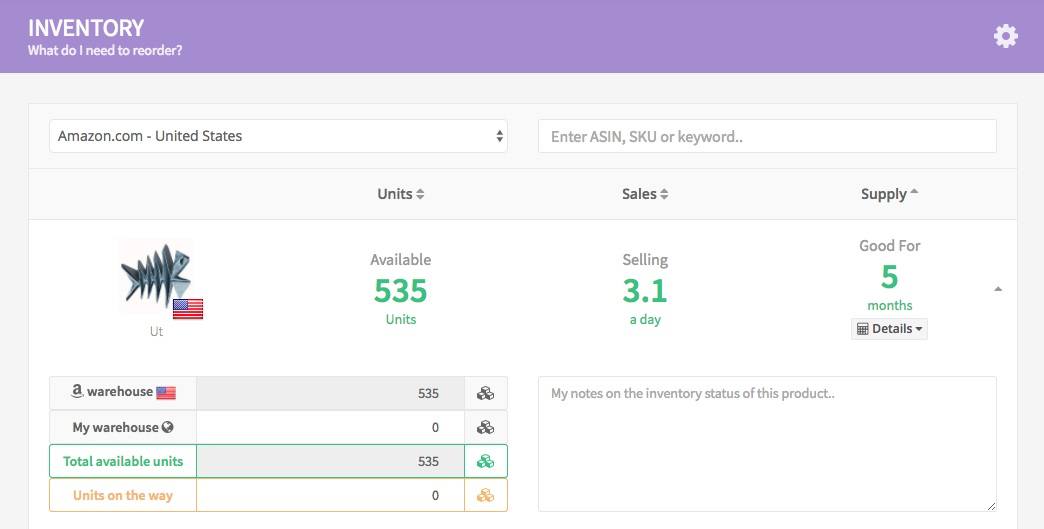
[22:16] Paulina: I will expand the row to start working on that. In my house’s basement, I actually have 100 units that I haven’t stocked yet. I enter that here and set “My Warehouse” to 100 units and I will quickly send this to Amazon. And because I’m next to an Amazon warehouse, it will be just a couple of days instead of shipping to China. So now I see that I am good for one more month, I have one more month to quickly make an order and replace this inventory. By the way, other sellers are using this My Warehouse option here. Very often, they’re saving money on storage fees, and they don’t keep everything in Amazon inventory in Amazon’s warehouse. They just send a little bit [of their units] and then the rest of the stock, they keep at home or in a warehouse outside of Amazon. So here, you can always keep track of how many you have. We take into account not only the Amazon stock, but also your own stock available.
[23:17] Paulina: This is a very useful feature to have. So now I entered 100. And now, I need to decide what to do next, and the app is helping me — it says “How many units to reorder”. To last five “normal months” and 2 “high season months”, you will need at least 360 units. The app is helping me very nicely, but I have no idea what a normal month is and what a high season month is. So let’s say zero. And I would like five regular months, I guess, just because Amazon will charge me long-term storage fees if I hold it for longer than six months. So I would like to last for five months, how many units do I need? The app says I need 216.
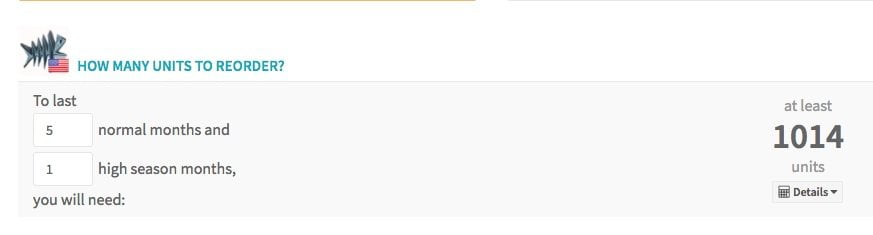
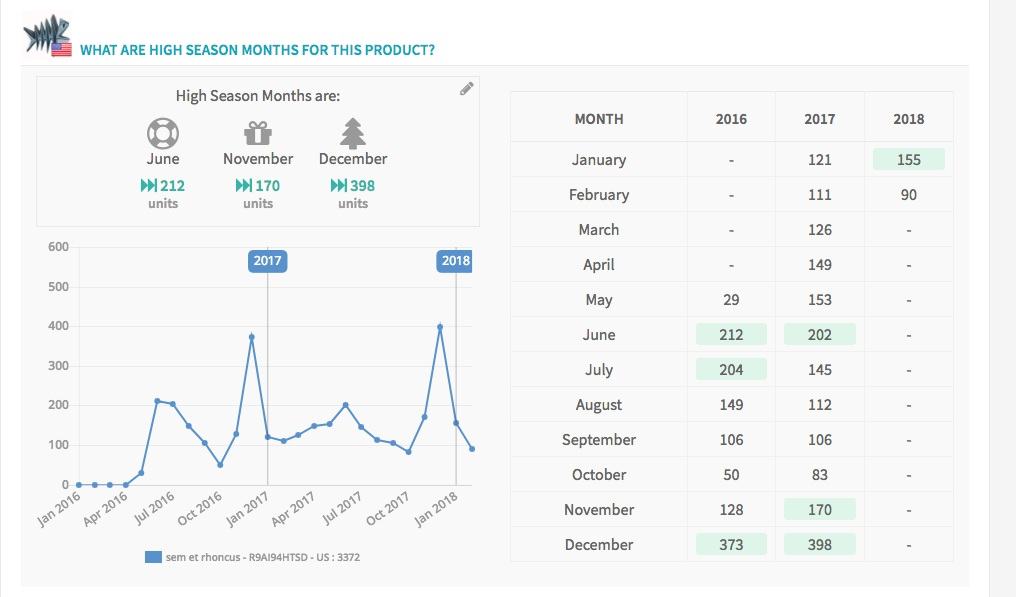
[24:16] Paulina: I’m not fully happy with that yet. I’d like to figure out what are these “high season months.” What does that mean? So the app will help me again, of course. So here is the section where it answers the question, “What are the high season months for this product?” AMZPing actually analyzes my data, which is 2015, 2016 and 2017. These are all the sales month by month, and the green highlights are the ones that are the highest sales in those years. So in 2017, it was January, May and August that had the highest sales. In 2016, September, November and December. So this is pretty confusing. It looks like there is no real winner here. There’s no month that would be on the left, and on the right, the same green highlight. That means there is no real seasonality for this product. If you look at the graph — it’s also month by month sales here — you will see that they are just slowly growing and there is no big peak here anywhere. I will show you how the peak would look like. For example, this is a Halloween product that just ran out of stock because Halloween’s tomorrow, and you will see that in this graph, the peaks show exactly once seasonality happened — September and October. And the app very nicely determines this and just tells you right away, so you don’t have to think about it or analyze it. So going back to our case, it’s just slowly growing so there is no real season. I can just say that this is always normal months and I would order the five months. If you still don’t trust this number, the 216, and you don’t know how it’s being calculated, you can click the “Details” and it’ll tell you exactly how it made the calculation.
[26:08] Paulina: So for example, it says “Your normal month has 36 sales.” Let’s see how it got it. So it just takes the median from those numbers, calculates it nicely and times five becomes 180 units for your average sales. “High season” would also take the average of high season months and offer you to order that many units. And it adds a little bit for growth. So in this case, it added 20 percent, but I am not feeling safe. With 216 units, I would like 30 percent for growth, maybe even 40. 250 units then I would be safe. Plus, it’s a nice round number to place an order. So now I know that I need to order 252, but I am very short on cash. Amazon will only wire transfer me the money on November 1st, which is still three days away.
[27:06] Paulina: I cannot make the order today. I need to quickly calculate when should I make the order — the latest that it would still come on time — so the app will help you with that as well. It says here, “If I order today, when will it arrive to the warehouse?” And it says, “If it takes 30 days to produce, 4 days to ship, and 5 days for additional handling, then it will arrive on December 8th, when zero units is left in stock.” This is too late for me. I need it to arrive when there will be still some stock left. Because I don’t want to be out of stock. So I will probably try and negotiate with my supplier to reduce the production time. I will try and push them to make it in 20 [days]. So here, it could have been 15 days to ship by sea and I could’ve made it to ship by air in 4 days. So if I managed to reduce the production time and they shipped by air, there will be 10 more units left in stock if I ordered today.
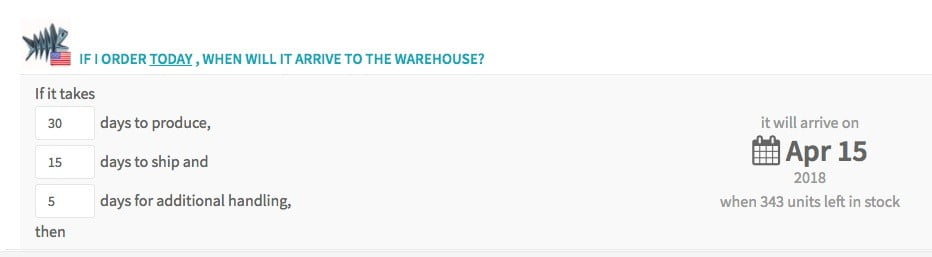
[28:13] Paulina: That is good. The problem is I don’t have money today. I cannot place an order. So I click on “Today” and I actually can choose a date to when I will be making an order. Amazon will be making a payment to me on the 1st [of November], I will actually receive the money. So I’ll say the “1st.” If I order on the 1st, I will still have 4 units left in stock. This is good news. Of course, you have to keep in mind that this is just an estimation — it could be that you have 20 left, it could be that you have zero left. But the app is doing its best to help you decide. So always use your own judgment. Use the app only as a helper. But this is a really nice help when you know what’s happening, without you having to go to spreadsheets and calculate it yourself.
[28:59] Paulina: So November 1st, I’ll make an order and I’m going to order 250 units. So here, there is a comment field. I will write “November 1st, to do, to place an order” and the order is “250 units.” I will write all this long sentence for myself as notes. And then I will write “Units on the way” is 250. Also, whatever keywords I put here — for example, “to do” — I can later put that in the search here and I will write “to do” and it will show me all the “to do” items that I have to do. So for example, this I have to negotiate, the other one I have to manage. So I can mark whatever keyword I like in this comments field and then use it to search for it as a daily routine. So this is the basics of how I use this. So I go through all of the items, I will see that I have total overstock on these ones, but Christmas is coming and I know that this might be useful. I am really bad with managing my stock, but the app is helping me so nicely, but I became better at it.
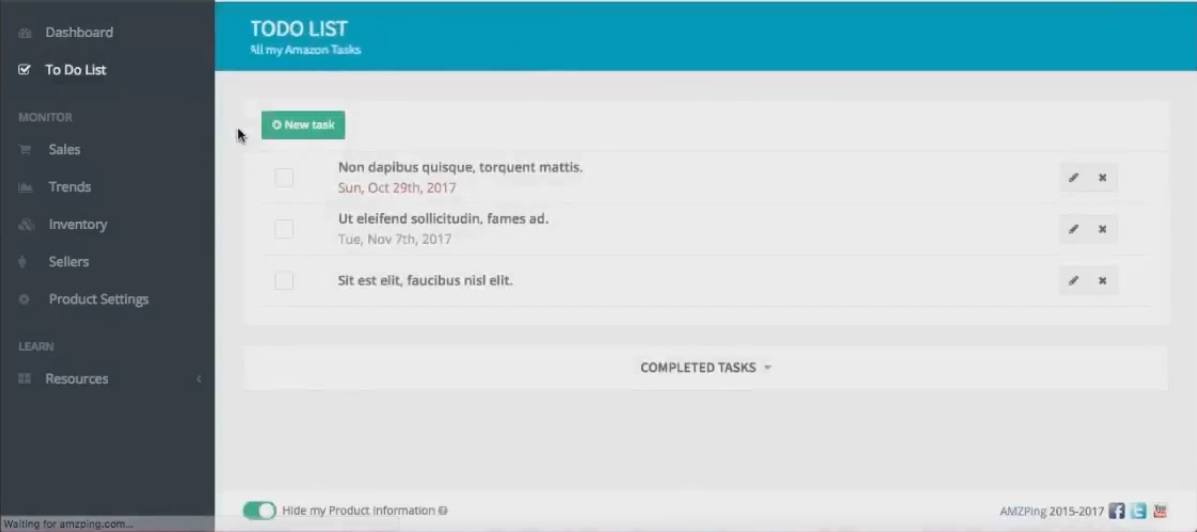
[30:08] Paulina: So that’s the basic two things. There is “Sales” and there is “Inventory” that AMZPing helps you to manage. There are some other things here as well. I will not go deeply into them, but I will just quickly show you what’s available. So for example, we have a “To Do List.” This is all obscured. Again, you cannot see my real to-do list, but here I would put “Make sure that the quality check is done on October 29th,” or anything related to Amazon business. And then I check the one that’s done, so this is just a standard to-do list. We have “Sellers”, which is the number of sellers. If you’re really worried about hijackers on your listings, you can see that. For example, my Canadian cobra is being attacked by three extra sellers. So one of them is me and the other three are hijackers. So here you can just look how many sellers on your listings as well and how it’s changing. And in the “Resources”, you can find some nice things like “Influencers”, the “External Tools” and “How-To Guides.” I will just quickly show you the “How-To Guides.” For example, I wrote this one recently — “How I Shipped my Amazon FBA products by sea.” So it’s a very long, nice detailed article for you. There are other useful things for you here that you can take a look at. And that is pretty much what I wanted to show you and how I use it.
[31:39] Augustas: Can you quickly tell us how easy is it to connect an Amazon account with your app, and how long does it take to download the first data once you sign up for the service?
[31:52] Paulina: Sure. So these are two things you asked. You asked how to connect. So let me show you how you connect. So when you log in to the app for the first time, it will tell you, “Welcome!” What it will do is a simple wizard, so all you have to do is click “Next”, then you will click on the marketplaces that you want to connect, for example, North America. And then you’ll have one yellow button that you have to click, “Connect to North America.” It will ask you to log in to your Seller Central Authorization page, so you will enter your credentials and sign in.
[32:33] Paulina: After that, when you sign in, there is one checkbox to check, and click “Next.” And that’s it. You are pretty much done. It says “You are almost done.” You click on “Continue” and it authorizes the app and you will be connected. So just as easy, you can connect additional marketplaces later by using the “My Account” page. You can go to your settings and you can connect the additional marketplaces here. For example, India. You would click here and see the same video from here as well. Now the next question was, “How long does it take to fetch the data?” So for trial accounts, we are limiting the data to 3 months. In total, you will be able to see 3 months of data and it will fetch it in about, let’s say an average seller, maybe three days. If you are a bigger seller, it might take a little bit longer.
[33:26] Paulina: As soon as you have become a paid user, we will fetch the rest of the data, but that limits to 3 years. So in the previous three years, you’ll be able to see very nicely like I was showing you for “Inventory” page, you can analyze your last three years of data. So it will fetch depending on how many orders you have, because there are so many things we have to analyze — the reports, the excel reports from Seller Central, API costs. There is limits. It will take, let’s say for three years of data, about two weeks or 15 days. But you will be able to use the app from the first day right away. You will get all the new sales which will be coming to the widgets right away.
[34:08] Augustas: And what kind of sellers are the best fit for AMZPing? Are they the beginners who are just starting, the medium sellers or the very huge fishes?
[34:25] Paulina: To be honest, we have all types of sellers using the app at the moment. But I would say the best moment to start using it is while you are a small seller, especially when you are introducing new products one by one. Because then, you can look at each of the product individually and analyze which one is doing nice. Once you’re done optimizing, you’re adding additional products, and the app helps you all along the way with that. So I would say that the beginner is the best fit for this app, but any size of a seller can use it.
[35:02] Augustas: Alright. And what kind of pricing do you offer at the moment?
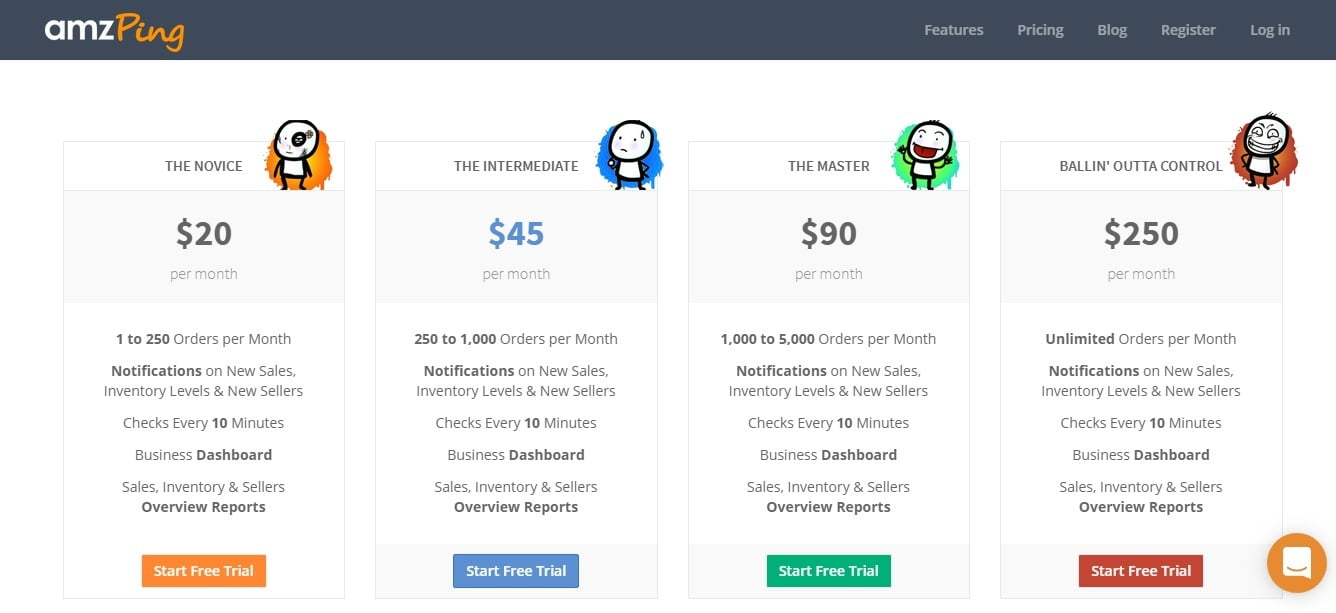
[35:06] Paulina: Surprisingly, I have a homepage opened on the other tab here, let me just open that up. This is our pricing. So pricing depends on your number of orders per month. When I said “Beginner”, I meant if you have less than 250 orders a month. If you have 250 to 1000, you would pay $45 a month. And if you have over 5,000, you would pay $250 a month. So if you’re a really big fish, we call you “Ballin’ Outta Control”. Most of the people in our app fall between “Intermediate” and the “Master” as an average.
[35:46] Augustas: Do you have any features planned in the near future that the subscribers will be getting?
[35:57] Paulina: Oh yes, we have so many plans. I have these ideas coming through my head every day and I decided to focus on the ones that my users want the most. So every day, I’m receiving requests from the users and those are the ones that I will be focusing. So the next things that are coming are three main things. One, we will be able to connect multiple accounts from the same marketplace. Right now, you can connect only one US account, one Europe account, but there is a need to connect multiple US accounts to the same app. So we will be doing that first. Next, the Inventory Management will be expanded. It’s not enough to do what I was showing you today. You would like to manage the local inventory as well and how it’s stored between the warehouses. This is especially useful for big sellers. So we will be focusing on Inventory feature expansion as well. And the third thing that we will be adding will be the Storage Fees. So we will be exactly reading which item and what storage fees occurred, and long-term storage and monthly storage as well. Right now, our app shows the Storage Fees, if you noticed. I’ll just quickly come back to that. There is a storage fees number here, but this is “Estimated Storage Fees.” So right now, we are estimating, but very soon, about a month or so, we will be pulling the actual storage fees with each unit, which will be very useful to know your real expenses.
[37:39] Augustas: I wanted to ask you about the Support. For me, when I’m using any kind of software, customer support is the most important. And the less responsive it is, the less likely I’m sticking to the app. Can you tell us a little bit about how you care for your customers? And how fast do you reply to the emails?
[37:59] Paulina: We have “Intercom.” It’s actually very useful. If you don’t know what it is, it’s the little chat on top of the app. So whenever you want to ask us anything or have a question or whatever it is, you can just quickly write us in the chat and we’re on 24 hours to respond. It’s not always that we are responding immediately, but the maximum it will take is 24 hours until we get a response to you. So using the chat makes it much more easier than for you to have to look for our email, create a Support Ticket, nothing like that. Just write us a question in the chat and we have a very nice management system for those questions that we answer them in time.
[38:41] Augustas: And I see actually in the chat, Thomas — when we were talking about the Sales Tax on your app — was saying that in the US, Sales Tax is different from the city of the buyer. Are you taking this into consideration?
[38:59] Paulina: Yeah. So you saw in “Product Settings”, there was no field [for the sales tax]. I think I didn’t show you. But other countries like the UK, they have a field because there is a set percentage. United States did not have that, plus it’s not included in the price in United States. So what we do is we actually read from Amazon order. Whenever the order comes in, Amazon tells us exactly how much was collected for tax and then we show that exact amount in your reports. So even though there was 6 percent [tax] in Florida and 5 percent somewhere else, we will show exactly the amount that the order had.
[39:41] Augustas: Alright! Thanks a lot. And do you have any kind of offer for Demo Mondays viewers?
[39:48] Paulina: Of course I have. So I like to offer anyone who’s watching an extended trial. Usually we have 2-weeks trial, but for Demo Mondays viewers, we will offer 45-days trial. So feel free to connect. There is no credit card required, you just connect your Amazon account and you can right away see your Inventory Value and things like that without even having to think about it too long.
[40:16] Augustas: I think for redeeming this 45-days trial, I will create a link which will be https://demomondays.com/shopkeeper. And if you click the link, it will automatically activate your 45-days trial offer. So that means people can download three months of data from their Amazon account and use it.
[40:40] Paulina: Yep, exactly.
[40:42] Augustas: Cool. Alright. Thanks Paulina! And if someone wants to get in touch with you directly, what’s the best way to do that?
[40:52] Paulina: So go to Shopkeeper.com and use the little chat button on the bottom of the page.
[41:00] Augustas: Great. Thanks a lot, and bye bye.
[41:04] Paulina: Thank you, Augustas. Bye.
Hi, nice informational video again.
I’ve signed up for the trial. What I’m really looking for is a software that can report my highest earning profitable lines that would be suitable for a lightning deal? Is there any software that integrates for lightning deals management? If not what would be one that i could use to assist in?
Thanks
Jay
Sorry, Shopkeeper (former AMZPing) does not do that. You can check Fetcher:
https://orangeklik.com/demo-fetcher/