Fetcher is a Profit Analytics tool for Amazon sellers to know how much money they’re really making. Instead of taking 5+ hours inside seller central figuring out profit, Fetcher does it for you with the click of a button. Sync as many Amazon accounts & marketplaces as you want and see your inventory, refunds, PPC, profit and more inside Fetcher.
 50% off after a free trial
Fetcher is presented by the product manager Maria Galindo.
Features and topics covered in this video:
00:32 What Fetcher is and what problem does it solve for Amazon sellers?
01:11 Which marketplaces are covered by Fetcher?
01:35 What type of Amazon sellers Fetcher fits the best?
02:22 How long does it take to pull the initial data from the seller central?
03:20 Dashboard – summary data of the business health
03:52 Daily emails activation with the summary of the sales and expenses
04:40 Five sections of the Dashboard: Sales, Units Sold, Costs, Profit, Margin
05:19 “Sales” section
05:42 “Units Sold” section. “Pending orders” calculation.
06:57 “Costs” section
07:28 Getting details of various type of fees and costs
08:40 “Profit” and “Margin” section
09:05 Summary data presented as a graph
09:28 Inventory Levels table
10:34 “Sales & Profit” page charts and SKU profit overview
11:29 How SKU “Unit Costs” are calculated? Getting details inside the single SKU page
12:47 PPC stats on the PPC graph for a single SKU
15:03 Creating your own analysis by exporting the data as CSV
16:24 “Expenses” tab – “Product costs” section
17:10 Using cost sheet template to manage hundreds or thousands of SKUs
18:04 Expenses – Re-Shipping tab
19:02 “Other Expenses” section – adding miscellaneous business expenses (regular and one-time ones)
20:29 “Refunds” page
21:23 Getting details about the refund of a particular order
21:58 “Product Breakdown” page
22:12 “P&L Statements” page: Revenue, Expenses
24:52 Product Settings: turning SKUs off/on from displaying on the dropdowns and from including in the calculators. Changing the names of the SKUs, hiding/showing switched off SKUs.
27:33 How VAT is calculated inside Fetcher?
28:26 Pricing
30:03 Upcoming features:
– more marketplaces: India, Japan
– more advanced PPC tool
31:02 What’s the best way to get in touch with the support team of Fetcher?
31:41 Offer: use this link to get 50% off the 2nd month (after the 1st month trial)
Transcript – Walk-through of Fetcher
[00:02] Augustas: Hello, everyone. Welcome back to another session of Demo Mondays. Demo Mondays is a video series where I invite Amazon seller software creators, owners and representatives to show their products. And today, my guest is Fetcher.
[00:02] Augustas: Fetcher is presented by its Product Manager, Maria Galindo. Hello, Maria.
[00:29] Maria: Hi, Augustas. Thanks for having me.
[00:30] Augustas: Yeah, nice to meet you. And could you briefly explain to us what Fetcher is and what problem does it solve for Amazon sellers?
[00:38] Maria: Absolutely. My pleasure. So Fetcher is a financial analytics tool. We all know, as Amazon sellers, that it would take you hours of painful work to go through Seller Central and try to figure out what your real numbers are. After all the fees — your storage fees, order fees and everything — how much are you really making? Now, pull those hours of painful work in the past because Fetcher will give you all that data with the click of a button.
[01:12] Augustas: That’s great. But the main question for international sellers is how many or which marketplaces are you covering?
[01:19] Maria: Absolutely. We cover eight marketplaces right now. On the Europe side, we support UK, France, Italy, Germany and Spain. And on the North American side, we support Canada, Mexico, and the United States.
[01:36] Augustas: And do you have any specific target user? Is it a private label seller who is a beginner or an advanced seller, or does it fit anyone?
[01:44] Maria: Absolutely. As long as you are a seller, it doesn’t matter what kind of selling business you have. Whether it’s FBA, FBM, Retail Arbitrage or Online Arbitrage, you will find benefit in Fetcher, but you do have to be actively selling. If you’re just getting started, you’re in the Product Research phase or you already have your products in the manufacturing phase, Fetcher won’t be of much help because, in order to show you financial analytics, we need you to have actual selling history. But as soon as you start making that sale, Fetcher can help you right away.
[02:27] Augustas: Nice. The users have to link their Amazon seller accounts with Fetcher, right? How long does it take to pull the initial data?
[02:29] Maria: Sure. In order to link your account, it takes less than five minutes. All you have to do is give us permission on the Amazon side, which we will walk you through the entire process. But once you do that, we will start collecting your data as far as two years back. And your most recent data, we’ll be able to get it right away, as well as future data going forward. But the time frame that it takes for us to get those two years worth of data, it depends on the size of your account. If you’re a small seller, maybe making 3000 orders a month or less, it will take only a few hours, maybe one or two. If you’re a million-dollar account seller, it will take a couple more hours than that.
[03:10] Augustas: Great. So let’s jump into the real product. Shall we see how it works inside?
[03:17] Maria: Absolutely. Let me go ahead and share my screen. Alright, so here we go. Now this is your Fetcher Dashboard and it tells you all your summary data of your business health right now, for the time frame that you select. But before I go in here, I want to talk to maybe one of those sellers that may not be able to check their financials 10 times a day. Maybe you’re like most sellers, including me, that I may only have time to check my financials every other day or once a day per se. If that’s you, we got you covered. You will be able to go to your account on the top right corner. Scroll down and here, you can elect to receive daily emails. These daily emails will go out to you in the morning, around 8:00 AM in the morning Eastern Time, and it will give you your information as I showed you in the dashboard — with all of your financials, your sales, your units sold, your profit, PPC, any other expenses — everything in that one email. And as you can see here, you can add as many accounts as you want, and it doesn’t matter.

[04:24] Maria: We will be able to support all of those accounts even if they’re from the same marketplace. For example, if you have five different brands in the US account, you can go ahead and add them here. We’ll go ahead and pull that data for you and support you. Now, going back to the dashboard. We have these five very important sections here — and this is a real account by the way — but I’m going to go ahead and say “Katie” as the owner. Katie wants to see her business health for the last 90 days, which is what I selected here in the calendar. She’s getting ready for a meeting with her team members and she wants to be able to present this data to them. I selected 90 days, but you have multiple different options already here in the calendar, but you can always customize it to whatever you want. All you have to do is just click on the date that you want.
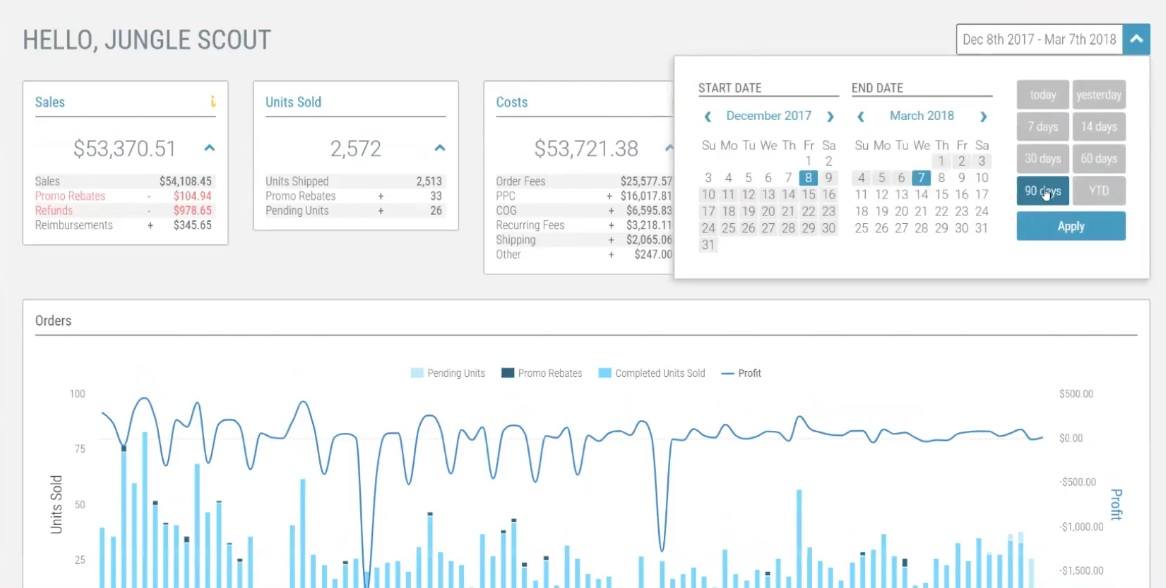
[05:17] Maria: Click “Apply”, and data would populate for you. Now, going back to the five different sections here, we have your actual revenue, which is this number, and then you have on top, your $60,638. That’s what we call your “Adjusted Revenue” and what that is is $61,000 minus your Promotional Rebates, your Refunds, plus any Reimbursements that you had for that time frame. We’re showing you your “Units Sold” here, units shipped, any promo rebates that you had during that time frame, and any pending units. Now this is very important here. “Pending Units”, as you know, are any orders that you had coming in, but Amazon has not shipped yet. And as most sellers know, Amazon does not consider an order confirmed until that order ships, because many things could change — including the customer canceling. Pending Units, depending on the size of your account, could account for a lot of revenue.
[06:18] Maria: So you still want to know how much revenue that is even before Amazon ships the order out. Because of that, we created a special algorithm in Fetcher that even if the order is pending and Amazon has not send us the confirmed information on the revenue, we will go ahead and create estimates for you that we will add to this number here. The estimates will be based on past sales history. That way, you don’t have to wait hours or maybe even days until Amazon ships out that order. And as soon as they ship it out, they’ll send that revenue information and we’ll update your numbers right away. On the third section, we have your “Costs” where you can see everything that were included in that total number of $60,000. And here, we can see that “Order Fees”, as always, will always be one of the highest, and that’s completely normal in every Amazon business.
[07:15] Maria: But then we noticed that you have a $17,000 “PPC” expense. So this jumps to Katie and she knows she has to take action because PPC is high. Another thing that comes out to her is the “Recurring Fees” and other fees. Now she’s thinking what that means. What are Recurring Fees? Well, you can always scroll down to your “Costs Chart” where everything is clickable and we give you the granular data of what those costs are. So let’s go ahead and look at your Recurring Fees, and here’s where you’ll see all of those fees that are being included in this bucket — with the biggest one, of course, being “FBA Storage Fee.” Now, if you want to see even the small ones and point out to them specifically, you can always unselect any specific fee. We’re going to go ahead and deselect “Storage Fee” right there.
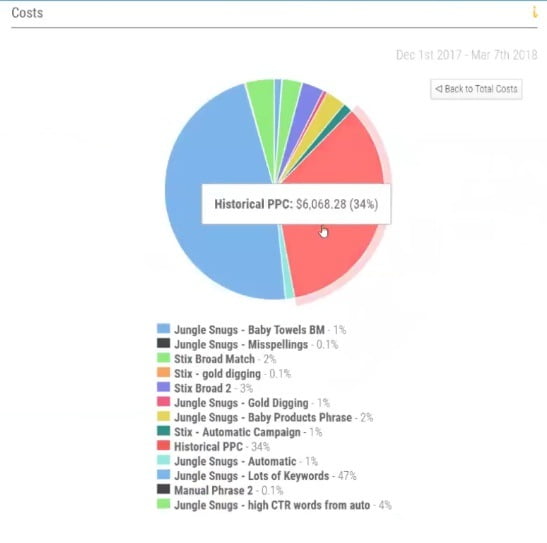
[08:16] Maria: And then you can continue and move, remove or keep adding expenses as needed so you can do your analysis. And the same thing for your Order Fees or your PPC, where it’s going to break it down by campaign for you. Wonderful. We’ll continue with the analysis and now we’re on “Profit” — your fourth section of where we will take your adjusted sales and subtract your total costs in order to give you the profit for the time frame that you selected. And from there, we’ll go ahead and take your profit, take your sales and divide it, which will give you, in this case, a zero percent Margin because as we found out, we have to decrease our PPC expense. For those of you that would rather see these same data on a graph, we also provide that here for you, where you can also remove data as needed for your analysis — it’s completely up to you. And you can continue to scroll down and like I showed you, review your Costs Chart or your Inventory widget, which is right here.
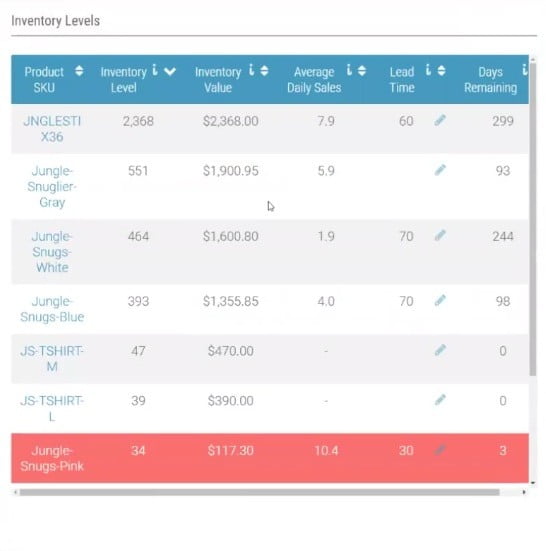
[09:25] Maria: We will pull all of your data, all of your SKUs data, show you your current “Inventory Level” and “Inventory Value” — the number of SKUs that you have multiplied by the “Cost of Goods Sold” number that you gave us under the “Expenses” tab, which I’ll go over with you in a minute. Your “Average Daily Sales” is your sales velocity for the past 10 days. Your “Lead Time” is very important because this is what will help you determine whether or not you’re going to run out of stock. And let me show you this one. For example, for the baby shower towel that we sell, we have 34 in stock right now, but we sell 10 of these a day and our Lead Time is 30 days. And this is the reason why it turned red, as you can see, because Fetcher is telling you, “Hey, you only have 34 [units left] and your Lead Time is 30. If you haven’t ordered by now, I’m going to go ahead and make this red because you will run out of inventory. So order ASAP.”
[10:36] Maria: Now this is your Dashboard. We’re going to go ahead and take a look at one of my favorite tabs, which is the “Sales And Profit” page. The reason why this is one of my favorite ones is because it will go into detail and compare, as you can see, and give you the side by side data. So you can do your own comparison analysis of how each SKU is performing. It will give you your “Return On Investment” and your “Gross Margin.” Here, you can see my best ROI is the baby towel — the white color — whereas the towel that’s not performing as good as the other ones is the gray color because it’s given me a zero ROI.
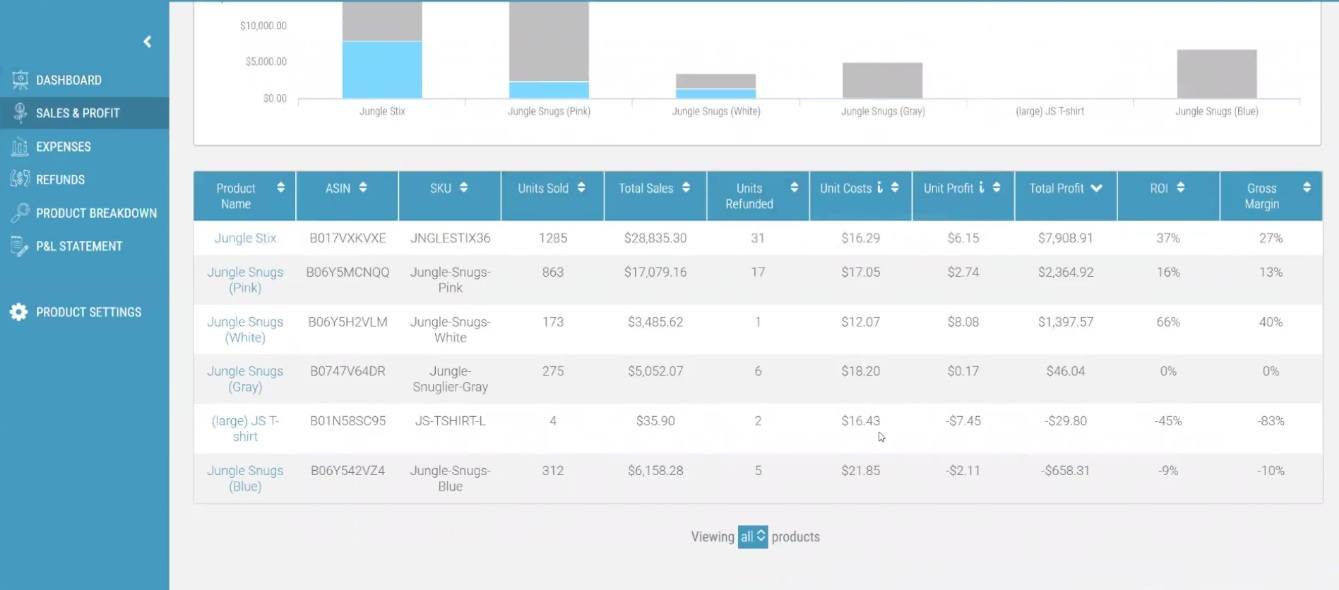
[11:22] Maria: Now, you can see from the columns that you can sort them as you like. But let’s say, you’re looking at your “Unit Costs” and you want to see the detailed data. From here, from the tool tip, you can see what we, Fetcher, take into account so we can calculate this. But you say, “Hey Maria, I see that your Unit Cost for the gray towel is $18.20. How are you exactly getting that number? I want to see what percentage went to the Reshipping or what percentage went to the Cost of Goods Sold.” No worries. You can get that data by clicking on the SKU title. We’re going to go ahead and click now. And it’s going to take you to your “Product Breakdown” page automatically. It’s going to keep the SKU that you’re looking at, as well as the time frame that you’ve selected. We’ll give you the data in a graph or, if you’re like me and you want to see the exact numbers, you will be able to see the sections here where you can expand them, just like we did on the Dashboard.
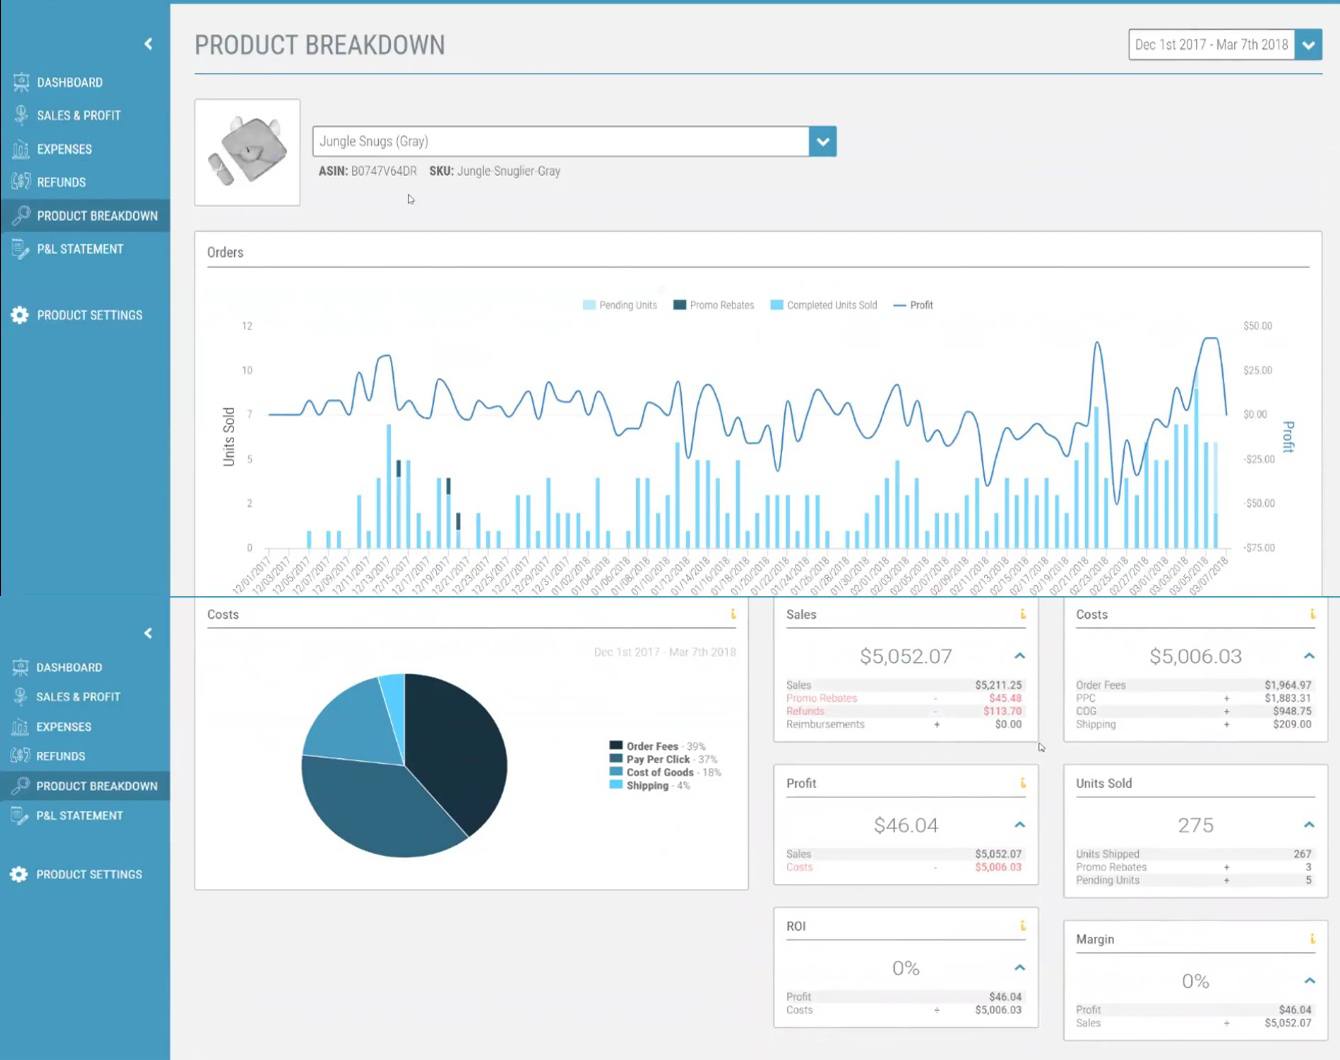
[12:27] Maria: Here, you’ll be able to see your Total Sales from Rebates, Refunds, and Reimbursements, as well as all of your Costs, Units Sold, Profit, ROI and Margin. And you also have a Costs Chart that you’re able to click on and be able to see all of your detailed data like we did on the dashboard. Another really cool thing I really like about this page is the “PPC” option. Now, why is this important? Because it will show you your “ACoS”, which we’re all familiar with, as well as your “PPC Sales” broken down per day, seven days and 30 days. And what this means is that if your customer clicks on an ad today and they buy tomorrow, that would be considered a “1 Day” type of revenue — because all they had was 24 hours to think about it before they actually clicked the “Purchase” button.
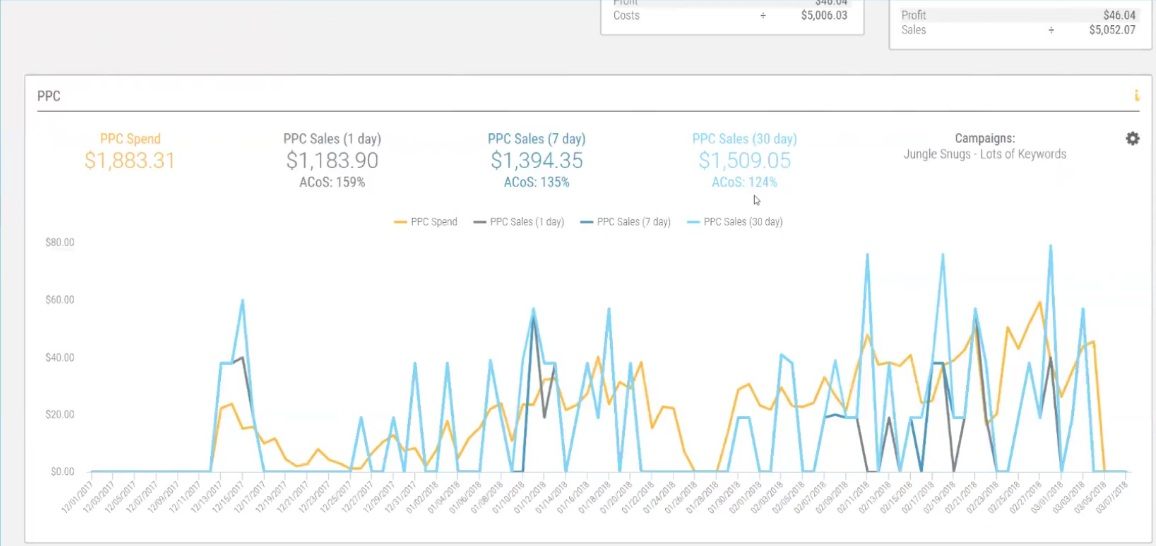
[13:31] Maria: Now you have “7 Day” and “30 Day” [breakdown]. What if your item is $200 or $300? It would require that consumer to give it more thought, maybe consult with someone else. In that case, they’re most likely to click for their out in the time frame, maybe six days out or 20 days out. You still want to be able to account for that revenue. So you know, “Most of my customers are clicking within 30 days. That means that I should not make changes to my PPC before 30 days because my customers are still thinking about it. My PPC is still doing an effective job just because most of my customers do take 30 days to think about it.” Depending on your type of product. But let’s say you have a type of product that maybe a lot less expensive, let’s say $20 or even $50, where they know they need it and they just require maybe 24 hours to think about it.
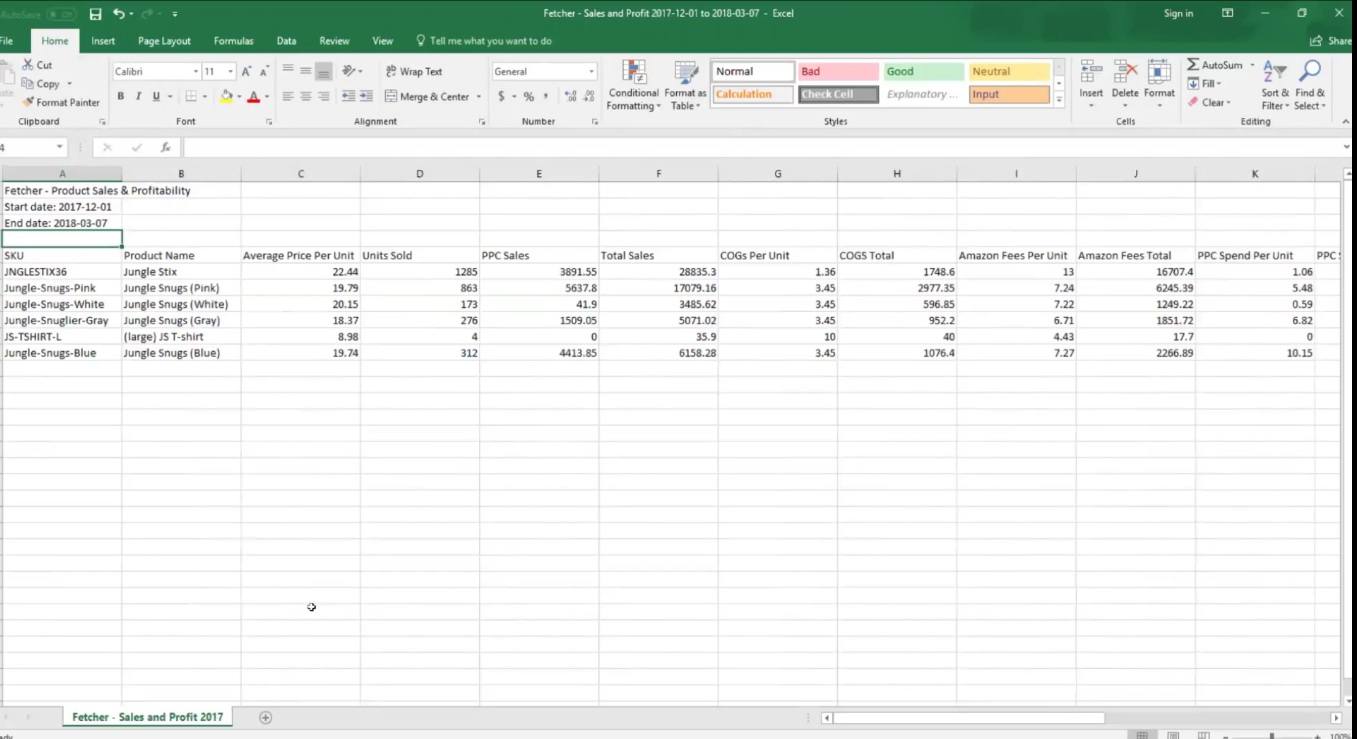
[14:32] Maria: They don’t have to consult with anybody and it’s within a price range that they feel comfortable with making a purchase right away. In that case, you will see most of your PPC revenue coming out of the 1 Day mark, so that tells you, “Most of my customers are buying within one day. That means that I don’t have to wait to make changes to my PPC. I can go ahead and after day one, if I’m not getting the results I want, let me go ahead and change my PPC Campaigns.” Because you have the actual data with you. Now going back to the Sales and Profit page. Something very cool that I want to show you is how you have all of these data, but you want to be able to create your own analysis, and if you’re an Excel power user like me, you can export all of these numbers to your computer.
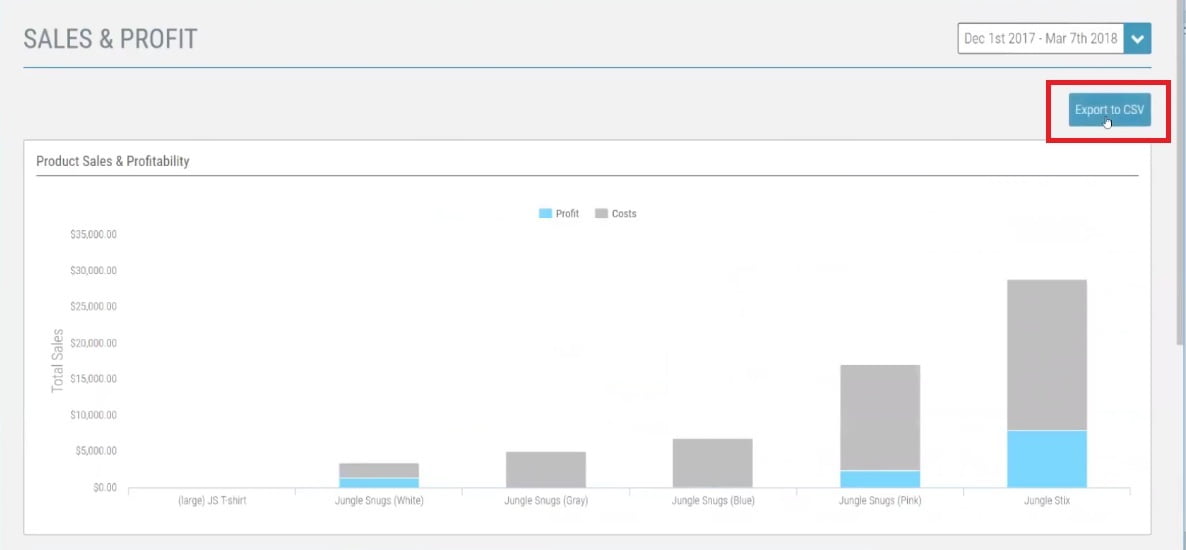
[15:24] Maria: It will download a CSV file, so max users can also take benefit of this. This is the report that downloads. I’m going to go ahead and open it up so you can see the Titles and we will show you the time frame that you’re downloading it for. If you had multiple accounts, we will tell you the marketplace and we will show you your SKU, Product Name, Average Price Per Unit for the timeframe that you selected, Units Sold, PPC Sales, Total Sales, Cost of Goods, Cost of Goods Total, your fees, your Fees Total, PPC Spend, any other expenses that you may have — and when I say other, I mean outside of Amazon, like photography, your trip to China to visit your supplier and things like that — Total Costs Per Unit — so you would sum all of the costs noted before — your Profit Per Unit, ROI and Profit Total Without PPC, and Total Profit With PPC.
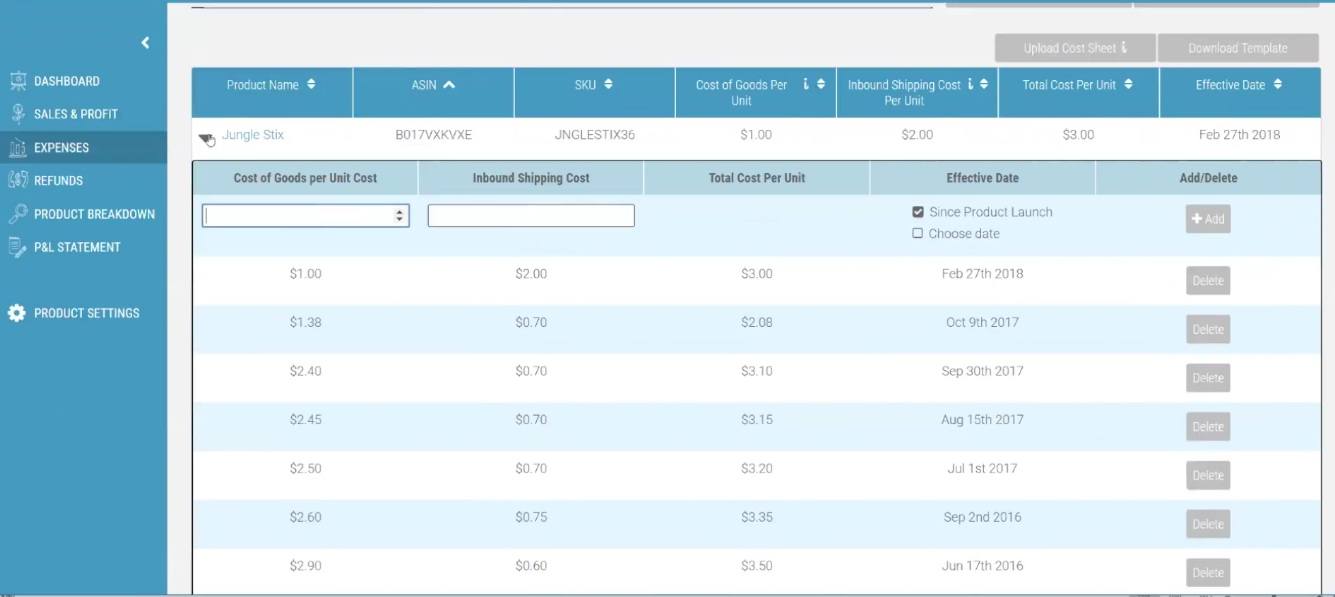
[16:25] Maria: Now moving on to the “Expenses” tab, we’re going to be seeing three different sections. The first one is your “Product Costs”, or what I keep mentioning as “Cost of Goods Sold.” This is where you’ll see all of your SKUs and the cost that you want Fetcher to account for for the Cost of Goods Sold and the “Inbound Shipping.” Now, Inbound Shipping. When we say that, we mean the shipping from your manufacturer overseas to the port in the country or marketplace that you’re selling at. And as you can see, you can expand each SKU so you could see your Cost of Goods Sold history and make changes, as you can see the pencil icon there, or delete any as needed.
[17:20] Maria: And if you have a hundred, 2,000, 10,000, I’ve even seen 100,000 SKUs, you don’t want to go ahead and sit down and do one by one. It will take you forever. Because of that, we created this really cool tool here where you can upload your Cost of Goods Sold — and in order to do that, you will download the template — and Fetcher will go ahead and download all of your product name, ASIN, SKU, and give you instructions on what to fill out and how to fill it out. As soon as you do that, you’re going to go ahead and take that same report. It’s going to download as a CSV file, so if you’re on Windows [OS], you can download it in Excel, or if you’re on Mac [OS], then Numbers, or manage it as however you like. And then take that same report that you’ve completed and upload as a “Cost Sheet” and Fetcher will go ahead and enter everything in there without you going line by line.
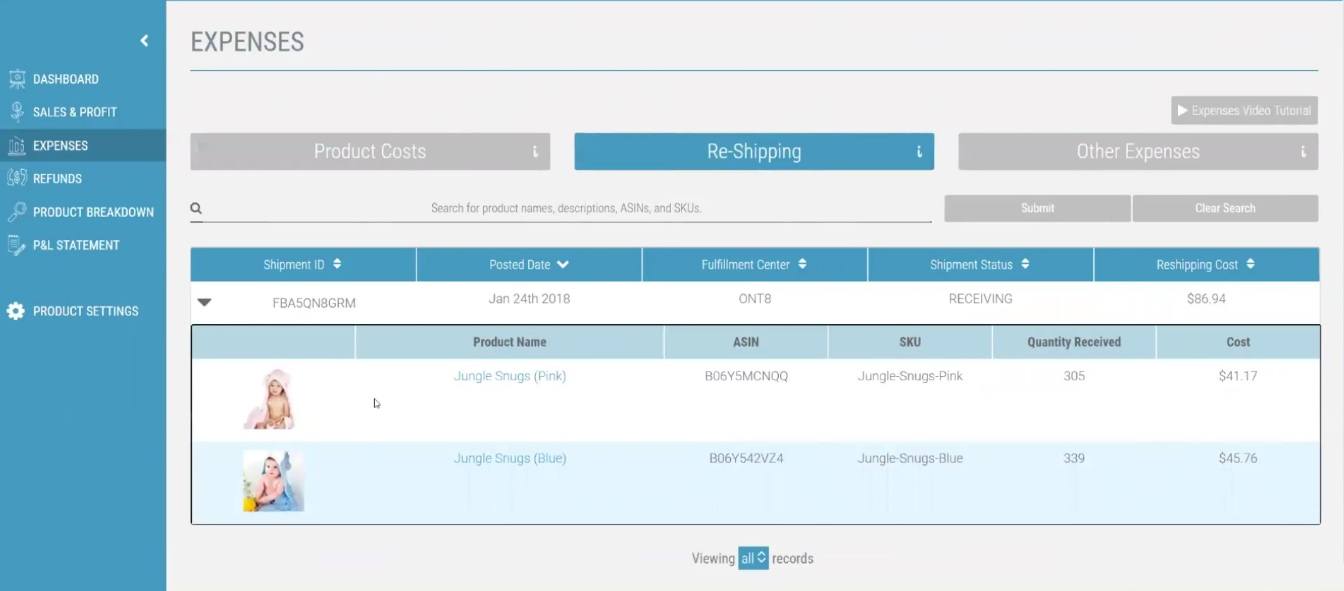
[18:07] Maria: Moving to the second section, we have “Reshipping.” This is the program called “Amazon Partner Carrier Services.” This is when you have your product at the port — most of the times, it’s California for the US marketplace — and you know that if you use Amazon and their carrier rates, it would be much better and inexpensive for you. And we’ll do this by going into Seller Central Shipping Plan and go from there. If you do use that service from Amazon that Amazon provides, you will see that expense noted here as Reshipping. And again, this is the expense to use Amazon Services and their freight forwarder rates. And what they’ll do is that they will go ahead to the port where you have your product, and take your product and ship it to the Amazon warehouse where they told you you had to go to.
[19:04] Maria: And then we have your “Other Expenses.” This is what I noted before as your photography expenses, or the trip to China expenses, and anything else outside of Amazon that you want to keep track of. For example, here, we have a couple of Re-Shipment expenses that were outside of Amazon that we still want to track. We have some software subscription, such as Jungle Scout, or Fetcher, or one of our other apps called Splitly, in this case. Something really cool I want to point out here is where it says “Product Name”, this column right here. As you can see, it gives you the option to account for an expense at the business level, as you can see here, “Jungle Scout”, or at the SKU level, such as this one. In this case, “Photography” was the expense only for pictures of the baby towel, color blue. So you don’t want to go ahead and add that expense for the entire business. Instead, you would just select the SKU that you want from here, and then Fetcher will account that expense only to the SKU that you want. And over here, you can tell Fetcher the frequency of the expense that we’re looking at — One-Time, Annual, Monthly, Weekly, or Daily. And you can add as many expenses as you like. You can enter your Description, your Costs, Dates and so forth.

[20:31] Maria: Now moving on to our fourth tab here, we’re looking at your “Refunds.” Again, you can select the exact time frame you want and Fetcher will show you all of the data for that specific time frame. We have, for this time frame, $1165.25 in Refunded Revenue. This graph will do a comparison per SKU. It will give you the “Count of Units Refunded” and very important, the “Return Rate of Units Sold”. Because we all want to keep track of our returns and the percentage of that, because we know what happens when your refund percentage goes up — Amazon takes action. They will usually reach out to you to see what’s going on. And here, we will show you the SKU that the refund came in for, the Purchase Date, your Order ID, and the Return Price.
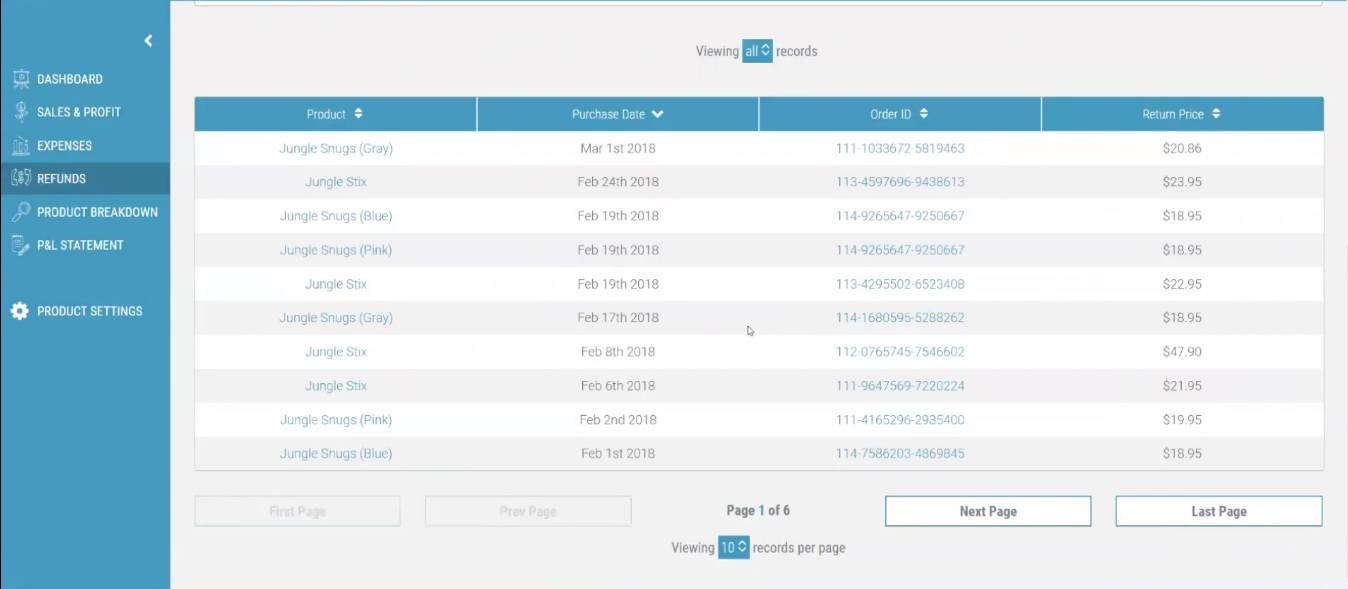
[21:24] Maria: Here, you will notice that the Order ID is in blue. That’s because we gave you the ability — if you want to see even more data for this particular refund — to click on it, and then a new tab will open up on your browser giving you the option to log in to Seller Central so you can go straight and see your details for that refund, instead of going into Seller Central and then going to the “Refund” and then go button by button trying to get to that specific refund. [In Fetcher}, you can just click and it will take you right there. We’ve already reviewed your Product Breakdown, which is similar to the Sales and Profit, but more in detail, so you can see the exact numbers that we’re pulling and see the calculations.
[22:16] Maria: Now, we have your “P and L Statement.” Now for Katie, this is very important for her because this is what she was going to go over in her meeting with the team. Again, you can select the time frame that you want to see, and Fetcher will do the rest. We’ll go ahead and display your Revenue and break it down by your Adjusted Revenue because we’re going to show you what we deducted, such as Promos and Refunds, and what we added, such as the Reimbursements. On your Expenses tab, we will show you all of the costs. Now, this is all at the business level — your Cost of Goods Sold, Inbound Shipping, and Reshipping. As you remember, Inbound Shipping is from your supplier overseas to the ports in the country or marketplace that you’re selling. And then Reshipping would be from the ports to the Amazon warehouse. And in this case, the Reshipping that we pull is from the Amazon Carrier Services you used, which I highly recommend. You get much better freight prices than you would if you were to sign up with the freight forwarders yourself. Your “Recurring Fees” — these are all of those non-order specific fees, such as storage fees, any refund-specific fee and so forth. Your Order Fees — these are straightforward: your FBA per unit fulfillment fee and your commission fee. And your PPC. And from there, we’re going to go ahead and list all the other expenses that you may have. In this case, “Software Subscriptions” and “Test Recurring,” which is probably for any other expense, but in this case, it was only used once, for January. From there, we’ll take the Total, show you your Net Profit, and your Gross Margin.
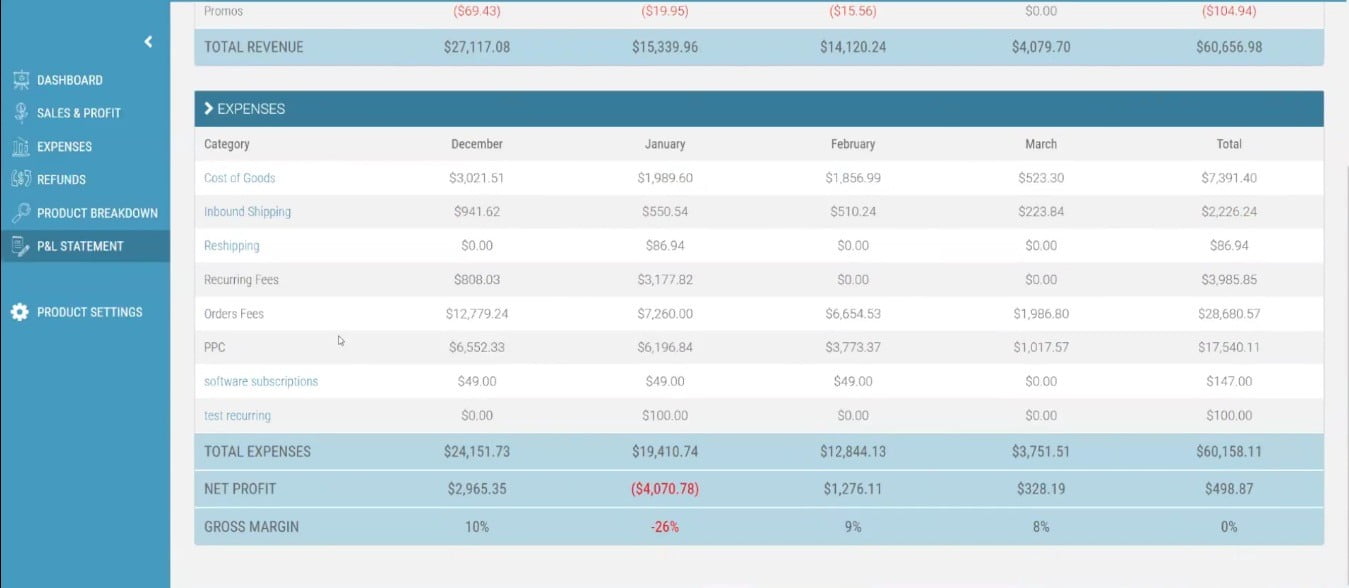
[24:14] Maria: And in this case, we’ll tell you month by month what the percentage was, so you can compare and use these to really dig deep and see where you can find trends. In this case, we did really well in November and in December. Now in December, we didn’t do as well as November because during this time frame, we were doing a lot of promotions. And because it’s Christmas, we had a lot of customers buy the baby towels as gifts, but we were doing a lot of promotions at the same time. So because of that, 2 of our best months were October and November.
[24:53] Maria: And last but not least, we have your “Product Settings.” What’s really cool about this is, let’s say you’ve been selling in FBA for a really long time, or you’re a Retail Arbitrage seller and you have a thousand SKUs. Out of the thousand SKUs, you’re actively only selling 100. Because of the way that the API with Amazon works, they will send us everything. Well, you don’t want to see everything because you only have a hundred skews activated. You can go ahead and turn them off as you wish. The “Include in Calculations” widget will give you the option to remove any revenue or any expenses from the overall calculations that you see on your Dashboard. And the “Display in Dropdowns” will give you the option to remove that SKU out from the Product Breakdown. Or if you want to go ahead and select it this way, you can go ahead and do that. When you select it this way, it means it won’t include revenue or expenses in the calculations from the Dashboard but it will still give you the ability to pull this SKU into the Product Breakdown, so you can do your own analysis separately from your overall business health numbers.
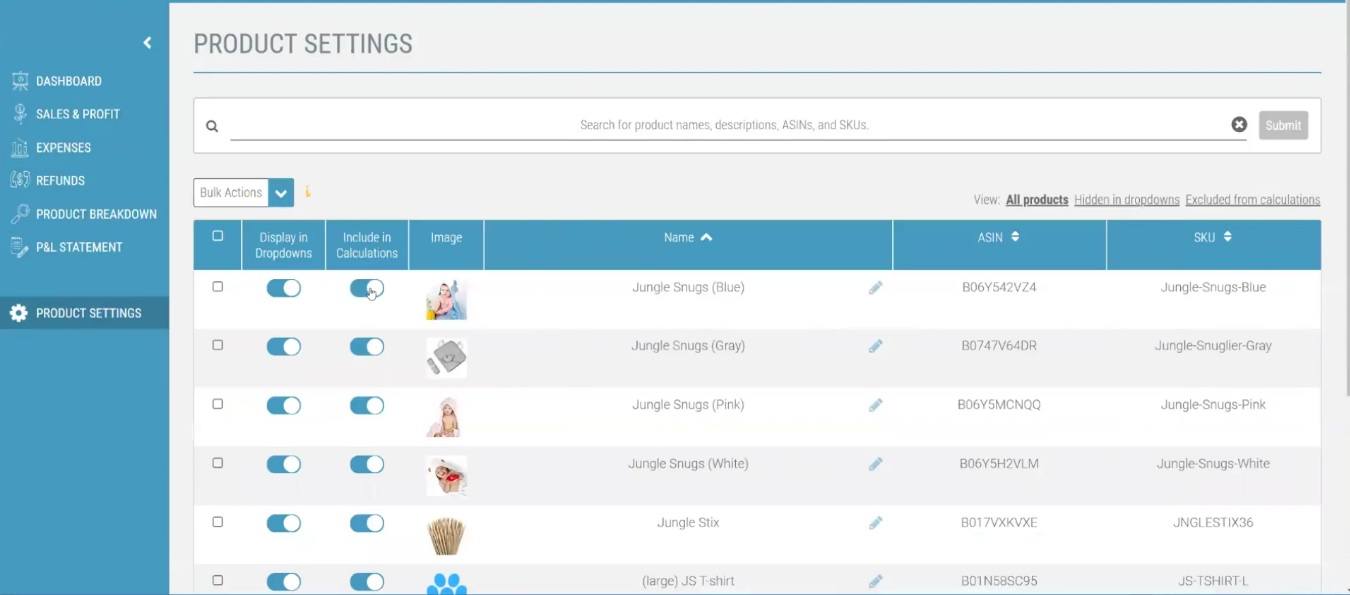
[26:16] Maria: And from here, you can also change — for those of us that have a one paragraph title in Amazon for SEO purposes — you can go ahead and change that name so you don’t see your entire paragraph name and change it to something that you feel more comfortable referencing. In this case, we liked “Jungle Snugs (Blue).” That’s it. But if you went to our listing for this one, we do have one of those paragraph-long title. But just for ease of use, we changed it here in “Product Settings.” staff. If you have, again, a thousand, 2000, 5000 SKUs, you can change anything here. And then, from your right side here, you can tell Fetcher, “Go ahead and show me only the SKUs that I have excluded from calculations or those that I hit from the dropdowns. Fetcher will go ahead and give you that data. But now, Katie is ready. She analyzed her business. She’s ready for the meeting she’s going to have later today. She downloaded everything — all her reports, her P and L statement (which she can do from the top right corner). She does a real quick five-minute look at her Dashboard and she’s ready for her meeting. She knows exactly what’s going on with her business in Amazon.
[27:35] Augustas: For international sellers, if they’re selling in Europe, do you add VAT into Fetcher?
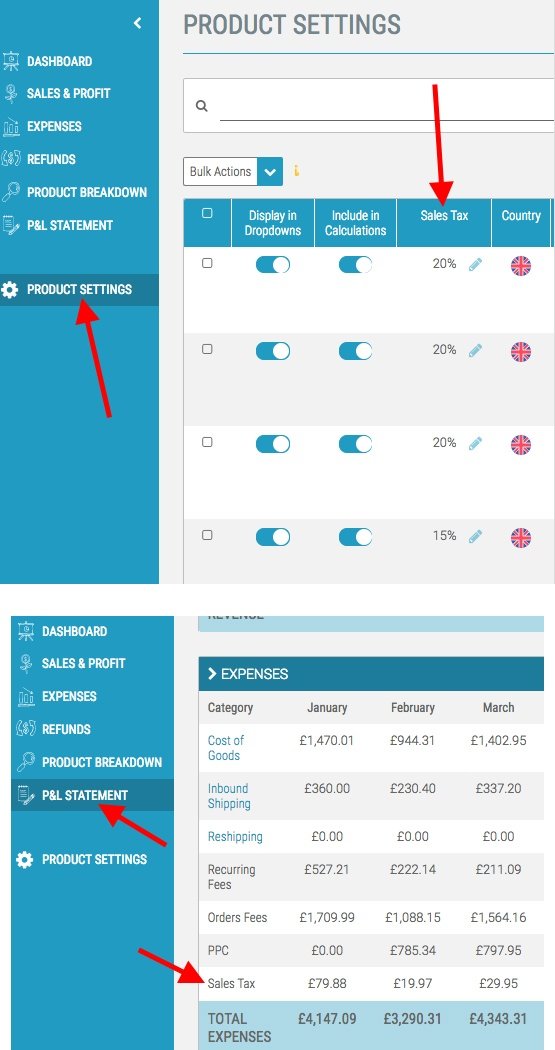
[27:42] Maria: I do. And let me go ahead and show you this right here, because the account that we’re looking at does not sell in the UK just yet. But for VAT, in the Product Settings tab that I showed you before, we gave you the ability to enter the percentage that you want to track for that specific marketplace. You have the option to select any marketplace. As long as you’ve synced it within Fetcher, you will have this option. After you do that, Fetcher will go ahead and recalculate every single tab inside your account. It started with the P and L Statement and we’re going to go ahead and pull the Sales Tax calculation into your Expenses and display it like that, a Sales Tax.
[28:26] Augustas: If everything is covered, could we maybe cover the pricing?
[28:31] Maria: Oh, absolutely. Within Fetcher, the pricing is set up in a way that you have all the features you need and all the features that we have in Fetcher. Meaning, it doesn’t matter what plane you’re in, you will always have all the features. The price instead is based on the number of orders that you process on a monthly basis. Why? Because that will determine the manpower that we need in the backend to get everything running and support your account. That’s why. Now, if you process 2,500 orders or less a month, your price would only be $19. If you process anywhere between 2,501 to 5,000 monthly orders, your price would be only $39. Or if you process 5001 orders a month or more, your price would be $99. Because we understand the pain that Amazon sellers have to go through to find out this information and their profits, we keep our prices very, very low and we don’t take any features out. All the features are available to everyone, including during the trial. We have a 30-day trial where you can try out Fetcher, no commitments at all, you don’t have to enter your credit card, but still, you can see everything that I showed you here. You can see it for your business. Make your own analysis, see the real value of Fetcher before you make any commitment. And you have all the features available.
[30:09] Augustas: Yeah. That’s a really competitive pricing. And can you reveal to us any features which are coming up in the near future?
[30:11] Maria: Absolutely. We are working on adding more marketplaces, including India, which we already support on the Jungle Scout side. For those of you that don’t know, Jungle Scout is our parent company. We’re also looking to support the marketplace of Japan in the near future. And we’re looking to enhance our PPC widget right now, even though as you saw, we do have a pretty great PPC tool. But I’m biased, of course. I use it a lot though. But we’re looking to make it enhanced and add more capabilities, because the PPC field in Amazon is getting harder and harder. We’re trying to arm — that’s what we want — we want to arm sellers so they know what they’re doing and save time doing it.
[31:05] Augustas: Alright. And how does the Support work? What’s the best way for users and potential users to get in touch with your Support team?
[31:14] Maria: Absolutely. If you’re already a user, on the top right corner of Fetcher you will see a question mark. All you have to do is click on that question mark and it will take you to our Support Page so you can contact us via email. Or if you’re on our website and you’re thinking about Fetcher, you will see a pop-up on the bottom left corner. You just fill out your information, give us a quick question and we’ll contact you within two hours tops.
[31:37] Augustas: Yeah, I like quick responses. Alright. And the last question is, do you have any offer for Demo Mondays viewers?
[31:51] Maria: I do. If you’re a Demo Mondays viewer, follow this link to sign up to Fetcher. This link will give you the 30-day trial, just like any user, but then, for being a Demo Monday viewer, you will get your first payment — which will be your second month, essentially — halved off, 50 percent only.
[32:12] Augustas: Alright. Thanks a lot for this great presentation and good luck in your business, Maria. Bye bye.
[32:18] Maria: Thank you so much. Thanks for having me, Augustas. Have a great day.
Great presentation. I already use Fetcher and got a lot of great tips on how to get more out of it.