Shopkeeper (formerly known as AMZPing) is an easy to use software, which shows Amazon sales and inventory data across all marketplaces in one place.
 FREE TRIAL
Shopkeeper is presented by the founder Paulina Masson.
List of features covered in this video:
00:27 What is Shopkeeper and What problems does it solve for Amazon sellers?
00:55 And what kind of Amazon sellers are you targeting. Is it for beginners or advanced sellers?
01:23 Marketplaces that Shopkeeper covers
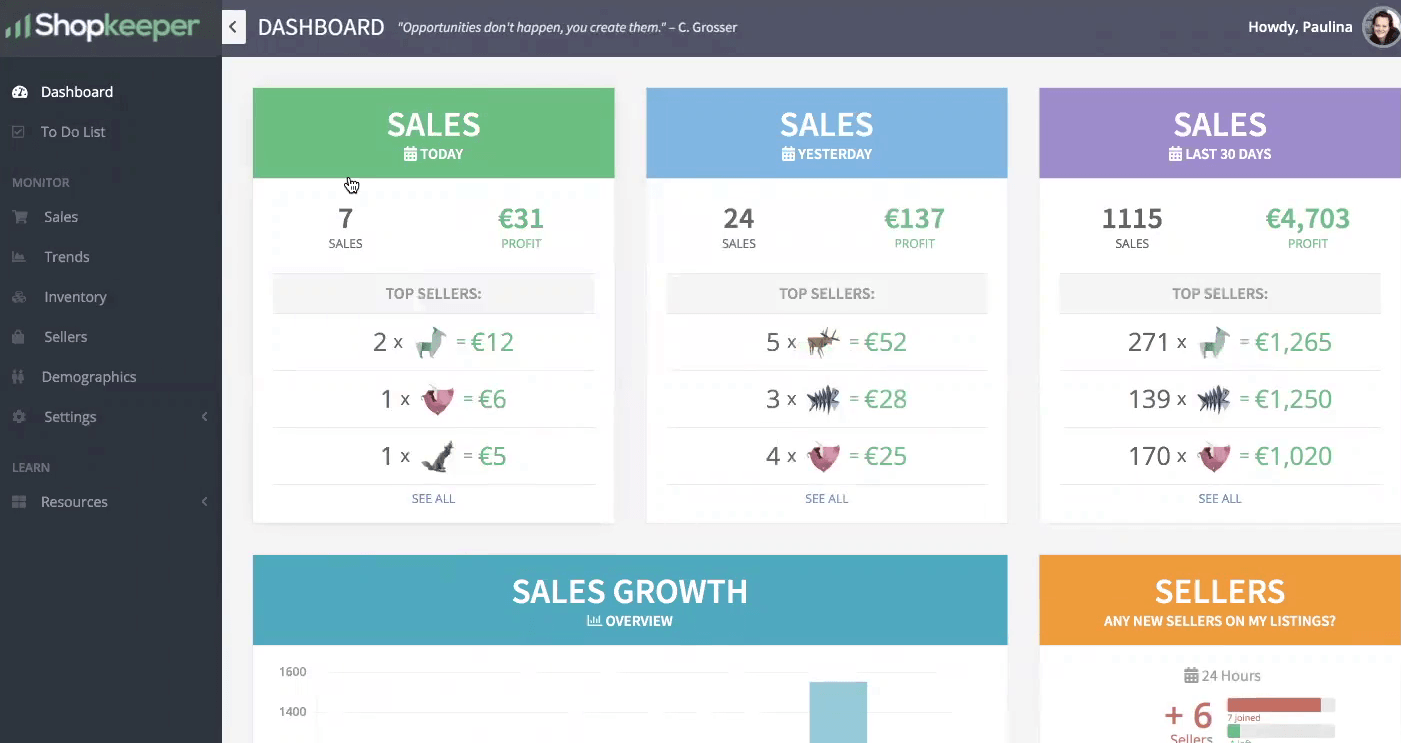
01:49 Shopkeeper dashboard overview
02:51 Information on how to organize your day as an Amazon seller using this tool
05:48 Presentation mode overview
10:08 Resources and external tools option
15:09 Analyzing refunds
24:22 What is Inventory forecast and Planning
27:51 Sellers sidebar overview
32:07 Comparing different products and different variations together
32:49 Information about the value of your current business
36:17 What features are you planning to implement for existing and future customers of yours?
37:47 What are the pricing tiers for using your software?
38:45 How can customers or potential customers contact support team?
Transcript – Walk-through of Shopkeeper
[00:00] Augustas: Welcome back to another session DemoMondays. DemoMondays is a video series published on Mondays where I invite software developers for Amazon sellers and I ask them to present a product just like this on the screen. And today my guest is Shopkeeper.
[00:19] Augustas: Shopkeeper is presented by the founder, Paulina Masson.
[00:24] Augustas: Hello Paulina.
[00:25] Paulina: Hi, how are you?
[00:27] Augustas: Hi, nice to meet you. And can you introduce Shopkeeper to us? What is this tool about? What problems does it solve for Amazon sellers?
[00:36] Paulina: Yes. So shopkeeper in one sentence is an automatic profit calculator. So instead of having to pull 10 different reports manually from Amazon seller central, it automatically calculates the profit so it pulls all of those reports from seller central and calculates your profit for you.
[00:55] Augustas: And what kind of Amazon sellers are you targeting. Is it for beginners or advanced sellers?
[01:02] Paulina: So it’s good for both, advanced and beginners, but if you do have only one product and it’s the first product that you started working with, it’s better to use Amazon seller central so that you can learn all the ropes and you would understand what it takes to actually pull the reports and calculate the data yourself before you start using any tool like Shopkeeper.
[01:23] Augustas: And there are a lot of sellers selling internationally. So the Shopkeeper tool, what marketplaces of Amazon does it cover?
[01:34] Paulina: So it covers 11 marketplaces, including the United States, Canada, Mexico, Germany, UK, France, Italy, Spain, as well as Japan and Australia. And we are currently in the process of adding Turkey as well.
[01:49] Augustas: Perfect. So let’s jump into the tool itself. Let’s see how does it look inside and what we need to know about your software.
[01:58] Paulina: Alright, let’s do it. So you know that shopkeeper is a business dashboard and you probably know a few other tools that are also business dashboards. And if you’re not familiar with other business dashboards in the world and you don’t know what is it good for, it might be a little bit confusing when you log in to know what exactly to do there, right. Most people that are new to this type of dashboard, they log into their account and they see sales was automatically calculated. The profit is €31 today, yesterday, €137, and over the last 30 days that much profit was made. And after that, most sellers that have never worked with a business dashboard before just don’t really know what to do or where to go look for more data and what to even do with that tool except of looking for these 3 widgets.
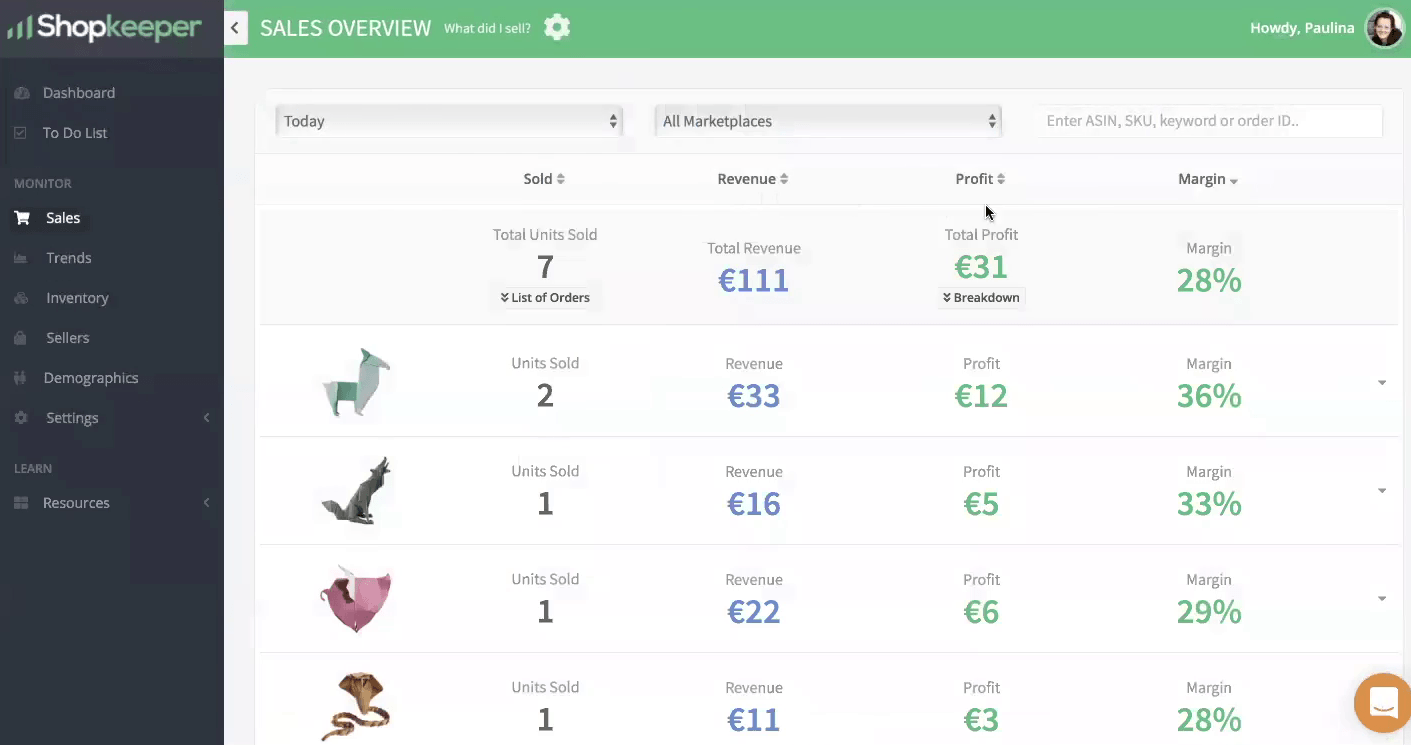
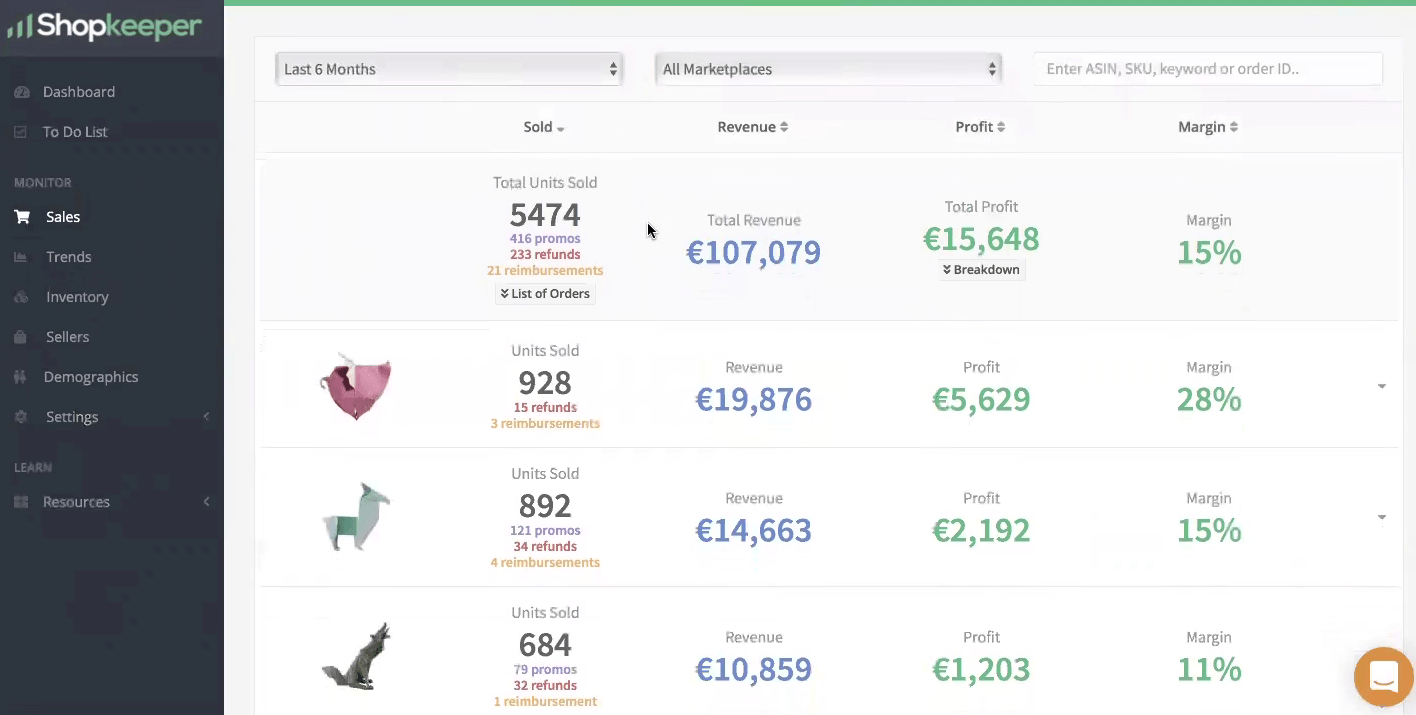
[02:51] Paulina: So today, exactly. That’s what I would like to tell you. I will tell you how to organize your day as an Amazon seller using a tool like a Shopkeeper. And how does business intelligence can help you to make very important decisions in your Amazon business to know exactly what is so important to work on while you’re looking at your numbers. So the first thing you could start with, I recommend is looking at your sales page and normally Shopkeeper is sorted, everything is sorted by the margin. So you could say the last 30 days, and you will see how it’s performing all by the margins. So this product is doing this good, this product is doing this good and it’s all just side by side. All of your products that you’re selling. So the best data point that I recommend starting with when you are looking for important information about recent activity in your business is to use 1 month that just passed.
[03:55] Paulina: For example, we’ll use November now, right now it’s not November anymore but I am choosing November because there are so many other fees that get charged later. So for example, November ended, but only on December 12th or 13th there will be a monthly storage fee charge that comes in. So that applies to November as well. On the 15th it might be a longterm storage fee charge that comes in. There will be some PPC data delays like 3 days long that’s going to be delayed. So it’s always better to wait a little bit to let the data to settle, so to say. So let’s say like a couple of weeks after a month has passed, then you can go backwards and look at that month to analyze the results and then you can see the real situation in terms of accounting in your business. So let’s take a look in this particular account.
[04:48] Paulina: Let’s say this is your account. You see that in the month of November you made €16,000 total revenue, but only €1,000 Dollars in profit and the margin shows 7%. Now if you are a private label seller, you probably know that the normal margins that private sellers are making is about 30% to 40%. So that’s a very good margin. That means that 7% is a red warning flag for you. Something is not going so well, and you need to know why and what is happening exactly, why is it only 7%. So the way we would analyze is this. So instead of looking by the margin, I would recommend sorting by the profit, but in the descending order so that you would see the worst performance first. And right away we see this orange cat product. Well, if you are going to think why do you see the products like this?
[05:48] Paulina: This is in fact the presentation mode. So you will see that the App has presentation mode and when it’s on, it hides the actual products, replacing them with origami images and then you see some Latin words, you can use the same presentation mode when you are screenshotting to share on facebook how you’re doing and so on. So that’s why you’re seeing strange products like this. So this is your account and you’re looking at this orange cat, only sold 1 unit in November and it last €269 in profit. So this is very bad. Something bad is happening. You would click to expand it and then you will see that currently in stock you have over 200 units of this orange cat, stalked at Amazon United States warehouse, but it is only selling 1 a month. So something is really bad and to know what is going bad, you will click on breakdown and you will try and find the problem in there.
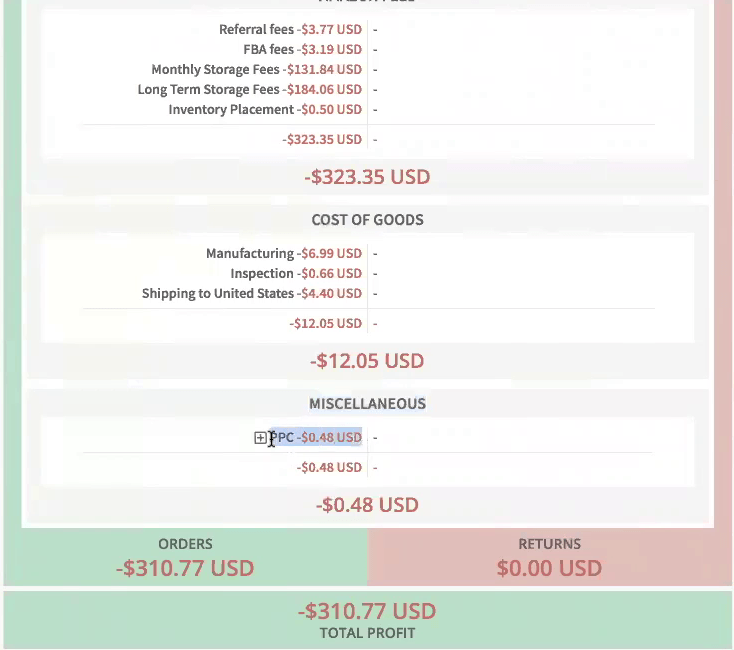
[06:47] Paulina: So looking one by one, not all the numbers, we probably go from Miscellaneous ones first because miscellaneous is the place where you will often find the problematic things. All the additional unexpected fees would end up there. You’ll see that PPC is not that expensive, that you’re not spending that much. This is just your cost of goods on the items sold and here it is. You see monthly storage fees and longterm storage fees are crazy. So just in 1 month of November, you have paid over $300 in storage fees. So that is exactly the problem. So if you want to have a very nice list of action, like that’s where you can normally go to To Do list and you can add a new task for yourself. So you will think of ways to move orange cat product. So To Do list will help you to organize your day, starting with the worst things that need to be worked on. You can set a To Do date for today so that it’s a very urgent item to work on. And that way you can always keep track of the tasks that are most urgent. So let’s go back to the profit view which was upside down.
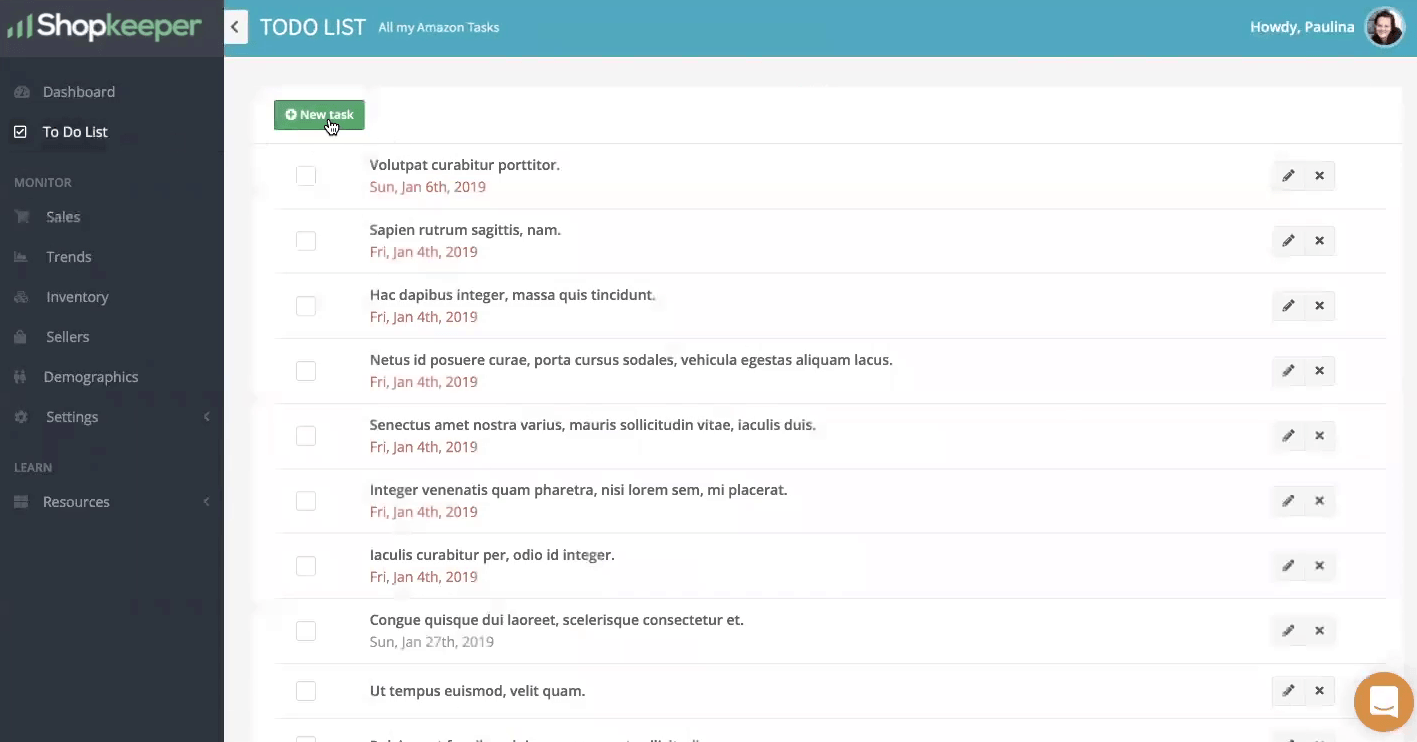

[08:18] Paulina: So you discovered immediately a problematic unit and you keep going one by one by one, checking what is wrong with those items that are eating your profit in, so to say that are losing you money, because normally in the business, the most important things to focus on immediately, other ones that are losing your business money, right. Because all the other things, listing optimizations, working on the images, making photo shoots, these are all more of a longterm type of tasks. But a business dashboard like Shopkeeper can show you what is important to work on immediately. So let’s analyze this other one. Look, this squirrel here, there was 40 units that was sold in November and we see that there was 24 promos and it lost money, on the breakdown, we will try to look for the problem. Why did it lose money?
[09:15] Paulina: And we see that PPC spend was very high, so they’re immediately is another To Do item that you could put for yourself. You could say that I need to now go and work on optimizing my PPC for the squirrel. So optimized PPC for squirrel product. And again, this is quite an important one. So you can choose the date for today. So what this does it puts in terms of importance, all the items on your To Do list. And then after you have done your analysis, you can come back to your To Do list and work on them one by one. Sometimes you may need more help than shopkeeper can provide. For example, just like you had this item that go and optimize the listing or work on PPC and you may not know exactly how these things can be done.
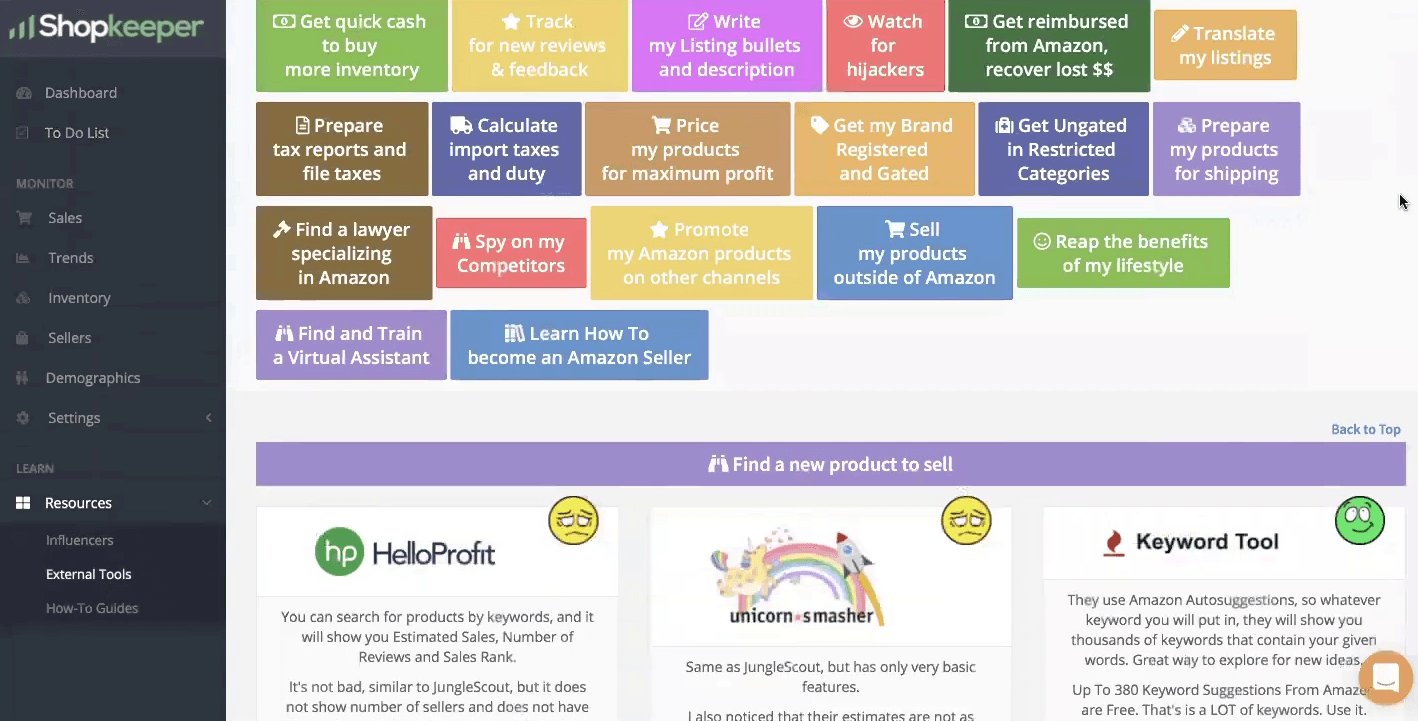
[10:08] Paulina: So we have an option here which is called, resources, external tools where we list many different Amazon related apps. So this is a big list of apps and that we provide for your convenience and for example, if you are not so sure how to optimize your listings and make your margin is better or how to optimize the PPC once you’re working on that To Do list item, you can come here for a reference or a list of exactly which items our apps can help you with something that’s Shopkeeper cannot provide, which is PPC optimization for example. So there are little reviews and evaluations and exactly the features that they are good for. Let’s go back to the sales page. All right, first thing you would do is you would look at the profit, so all the items that are costing your business money.
[11:11] Paulina: Now there is another way to sort it. You can look at your best sellers as well so you can sort it by the units sold and just look at your best sellers one by one and keep an eye on the margins, how they’re performing, and immediately your eye hits this one, right. This one lost money, even though the revenue was high and many units sold, so something must be happening there. So you expand to double check what exactly is going wrong and you are selling this product in multiple marketplaces, so you are selling in the United States and France and Germany and so on. In many different marketplaces. You’re selling the same item. Social people show them side by side by side instead of showing in original currency like this one is in United States dollars. This one in Canadian dollars, this one in British pounds, all of those are averaged and converted to your preferred currency.
[12:08] Paulina: So in this case your preferred currency is euros. So then very quickly side by side you can compare how it’s doing, not only by the margin but also by the amount. So this one made 174, lost 80, so side by side comparison is much easier than you would be looking at US dollar comparing to euro, comparing to a British pounds and so on. So it’s a very handy feature to be able to quickly judge, like in a millisecond you can just look at it and you already know that these are the problem items here in France, Germany and Spain, things are not going so well. So let’s look at the France one for example. Let’s expand it and try to find the problem. So we see that there is no PPC, there is no storage costs, so something else must be going wrong.
[12:59] Paulina: It’s possible that it’s priced incorrectly. See when the item is charged, there is also a VAT that is collected in France because you being a seller from Europe, you are collecting VAT. So once you collect the VAT, shopkeeper automatically subtracts this collected tax amount from your profit because it assumes that at the end of the year you being a good citizen will pay remit the VAT to HMRC. So you will pay your taxes that you collected at the end of the year to the government. So that’s why it’s subtracting this amount and in the end you see that you’re losing money. So this amount is so similar to what you’re losing, it’s very likely that you just forgot to take that VAT tax into account when you were working on your settings for each product and deciding the price. So you could go to product settings to double check that.
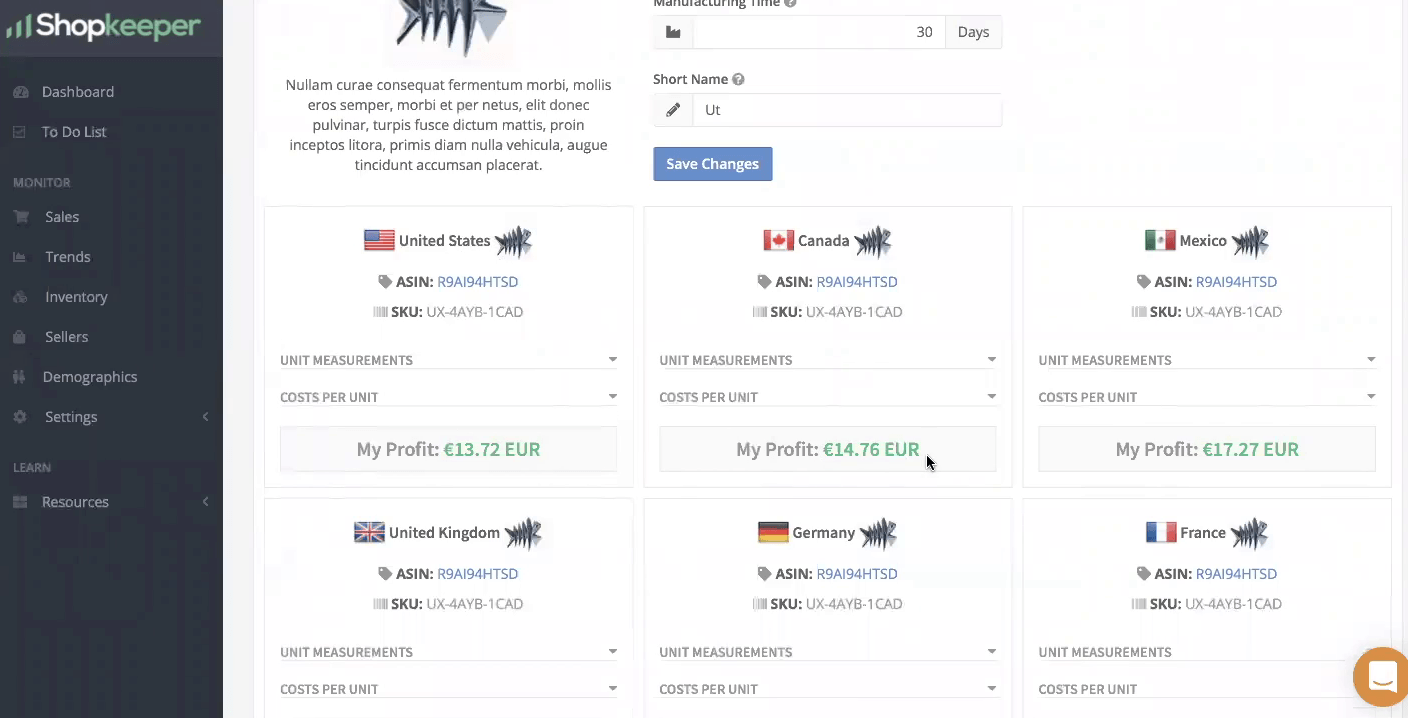
[14:03] Paulina: And normally in product settings you can see profit that is set for each country. You see that in United States you are making money. In Canada you’re making for 1 sale, you’re getting €14, but right away you see that in France you are in fact losing €3 on every sale and you expand to see what is the problem. And so there’s manufacturing and inspection shipping. You have entered all of these costs correctly. There’s the Amazon fees, but you probably didn’t take into account the VAT. If you disable the VAT collection here, you see that there is some profit. So this is immediately a red flag for you that you need to work on the prices and think about VAT being included in French price. So in that case you would go to your To Do list and add another item which is work on the price for France and Germany for this item.
[15:09] Paulina: Other things that are important are for example, refunds. So let’s look at the refund rates for the last 6 months. Let’s say you would again sort by unit sold and look at the last month, how your products are performing in terms of refunds. What you could do is this, you could come in here and quickly judge what percentage of units sold is the refunds. So here normally many categories on Amazon have an approximate 10% refund rate that Amazon is tolerating. What that means is that if your refund rate goes over 10%. So if you get 11% refund rate, Amazon suddenly suspends the listing and sends you an email saying that your refund rate is too high. Please send us the action plan, what you’re going to do about it, so you as a seller have to keep an eye on refund rates and try to help your product.
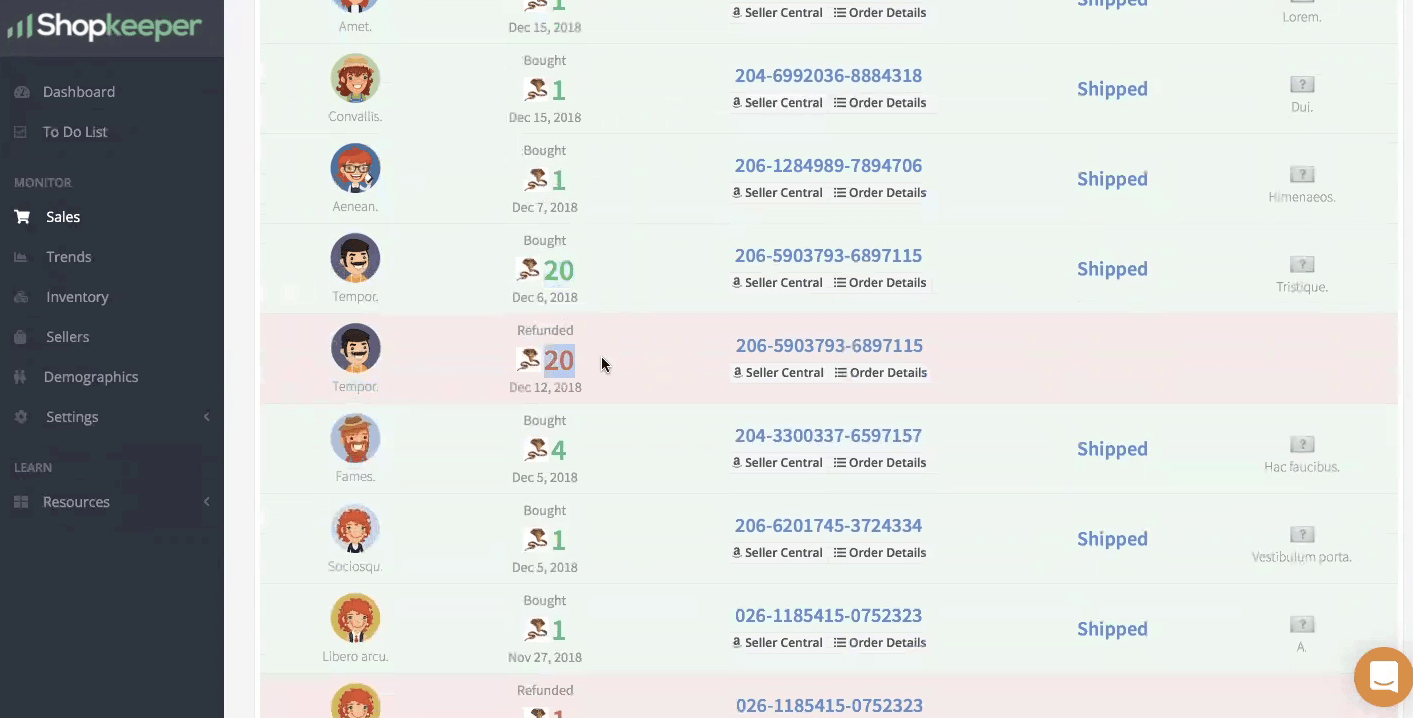
[16:10] Paulina: So you have to work on it to reduce the refund rates. So in Shopkeeper you can figure out exactly which items are performing badly. So let’s say out of 928, so 92 would be 10%. So this is only 15, so it’s doing good. This one is 34, 32 out of 684 is okay. So all of these we are skimming and see suddenly this Cobra Product has 27 refunds out of 211 items, so that is a higher refund rate than we would want. We would expand it and look into it. We see that in United States is doing pretty good, only 5 refunds out of 133. But in UK for some reason refund rate is like 30%. Look at this 22 refunds out of 63, you would probably expand the list of orders and just try to see what happened with these refunds.
[17:15] Paulina: Who is the guy who refunded and there you go. You see that this guy whose name is Tempor, so it’s an actual buyer’s name that will be provided for you. Here we see that he in fact ordered 20 units and refund that 20 later. So he didn’t want all of the 20 units. And this is not a typical case. This product is usually sold by one each, that means that this refund rate could be ignored at the moment because it’s out of the ordinary kind. It’s not really that many people bought and refunded, this Just one guy with a big order refunded one so we can safely ignore this one for now. Just keep looking what else hits our eye. And we see this one with the red pig here in Canada.
[18:07] Paulina: It says 22 items sold then five refunds. So that is over 20% refund rate. And the margin is so low, let’s look at the numbers and analyze. This is always what you would do. So when you see the refund rate is high, you want to see if it affects your profit margin. Margin is pretty low and normally when you get a lot of refunds, it’s a big cost to you, and in fact when you’re looking at the numbers, you see that you’re not spending on PPC monthly storage fees are pretty normal. There is no any other thing that is pretty big charge here. So all of this low margin is just purely affected by the returns and the amount of refunds that are affecting it. So there are two things you can do after you see something like that. One of the things, obviously you will go to seller central and pull a report of all the return reasons and try to optimize your product itself.
[19:11] Paulina: This is a longterm thing and you will have to think about what problems people are complaining about and so on. But in terms of numbers, if you want to quickly improve your margin, what you can do is you can incorporate this amount that the refunds are costing you into your price, so you would raise your price by a little bit just to accommodate for the refund rate and Shopkeeper exactly will help you to decide by how much you can raise the price in order to raise your margin a little bit to accommodate for that refund. So how it would do that, you will do this, you would click on the list of orders and find one that is refunded. So for example this order ID, we will click on the order details and now it’s specifically breaking down, showing that particular order ID, which was one unit sold on one refunded.
[20:04] Paulina: We expanded and we analyze it. Everything on the left side will be related to when the order came in. So all of the transactions when the order came in. So there are fees that got charged. You spent your cost was manufacturing, shipping and so on and on the right side, everything related to when the refund came in. So let’s analyze line by line, you would exactly do like this to see what specifically your costs are when every refund comes in. So look, when the order came in, $35 was charged, but when the refund got submitted, Amazon took back from you $35. So it gave back the customer their money. So it took back from you. Now you’re also collecting tax in Canada, let’s say. So the tax was reversed even back to the customer, referral fee was also reversed.
[21:00] Paulina: But look at this FBA fee was not reversed. That means Amazon was in fact picking and packing your product and delivering to the customer, and this is the fee that cannot be reversed because they already did the work and that’s a cost that they incurred. So when the refund comes in, this does not get refunded to you so you don’t get back that money. You also don’t get back some other things like sales tax collection fee doesn’t get reversed and in addition to everything, you also get charged the refund that administration fee right here. Other things like your cost to manufacturer gets reversed because the item will go back to the inventory and you will resell it later so this cost will show up on the new sale. So you’ll see in the end when you sell this one item and it gets refunded, the cost of the transaction, that Amazon will charge you, it will be -14 CAD.
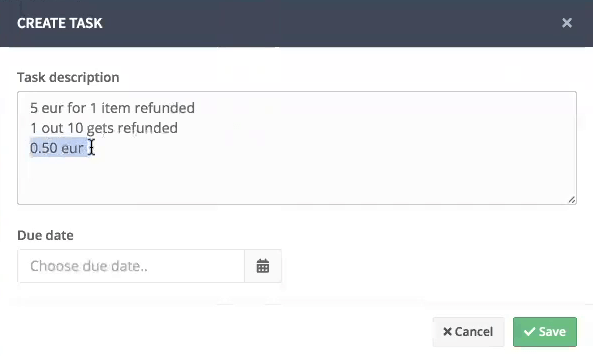
[21:56] Paulina: When you sold it, you made a profit of 672. So in total when you sell one and the one gets refunded, totally your cost is $8.14 CAD. To say it in your preferred currency, that’s about €5. So that’s what you would think about. You just keep in mind that it costs you €5 for one item refunded. So while you’re keeping that in mind, you know that 1 out of 10 items is getting refunded. You have about 10% refund rate. I’m looking at the general rate here. So out of 45 refunds were submitted. That means about 10% you’re getting. It’s a little bit more than that, but let’s say it’s just 1 unit out of 10 gets refunded. So what does that mean is that every single unit for you cost €0.50 if you accommodate for refund.
[23:05] Paulina: So because €5 is for 10. So each one of the items that you ever own always cost you extra €0.50. And that is exactly what you would do. You would go to seller central and increase your price by €0.50. This red thing, you would go here and you would find it in the settings and once you find it there you will check what the current price is, what you’re charging. So we’re talking about Canada and we see that the current price you were charging is $35.11 CAD. Those $0.50 are actually pretty accommodating right now because you can just use the cents amount, you don’t have to change the main number. That is very good news. So in this case, I personally would recommend just to change it to $35.99 , so you are a little bit more than the refund rate, but you’re just changing the cents, maximize the cents space. And that way Shopkeeper can show you exactly how much you are losing on each refund and how much you could a little bit patio price by to accommodate for that to get back your proper margin that you are expecting.
[24:22] Paulina: There’s another very good thing that you can use Shopkeeper for is your inventory forecast and planning. So for example on February 15th, usually or twice a year, European marketplaces like UK is charging the longterm storage fee. And let’s say you just received an email that later you will get charged the longterm storage fee and you have to now go and check which items are sitting in the warehouse in which you have overstocked that you may want to maybe take out from Amazon warehouse, not the bill of them, storage fees. So let’s look at the situation in the United Kingdom. You see that these two are less than 100 units and there’s normally a good idea to just leave what is less than 100 units in stock because once you become very low on stock, it actually affects your ranking a little bit. So if it’s less than 100 units, I would leave them in stock, especially if they’re not some huge furniture items.
[25:30] Paulina: And this column here tells you how many months it’s good for, so you can see that there are some items that only good for little bit and they will sell out soon. So this one good for 2 more months. This one for 4 more days. This one already out of stock. But I see some two big number of units available on two of the items that are good for very long. So this one has 300 units and it’s good for 24 months. So this one definitely needs to move out of the inventory. Like, I mean, I have to submit a return request from Amazon and ship it out to external warehouse, store it there for cheaper and then bring it back later on and the same you could do with this one as well. If you want to analyze deeper and not just rely on a number of that, Shopkeeper calculates, you have a lot of available information about this item if you want to know, it can help you decide how many units to order. It also can show you what are the highest season months for this product. So in particular, this product has January, February and December. Seems like these are the highest seasons. And also there is a calculator. One it tells you when it’s going to arrive to the warehouse if you order it on a specific date and how many units are going to be left in stock by the time it arrives. So you can plan your inventory ordering with that.
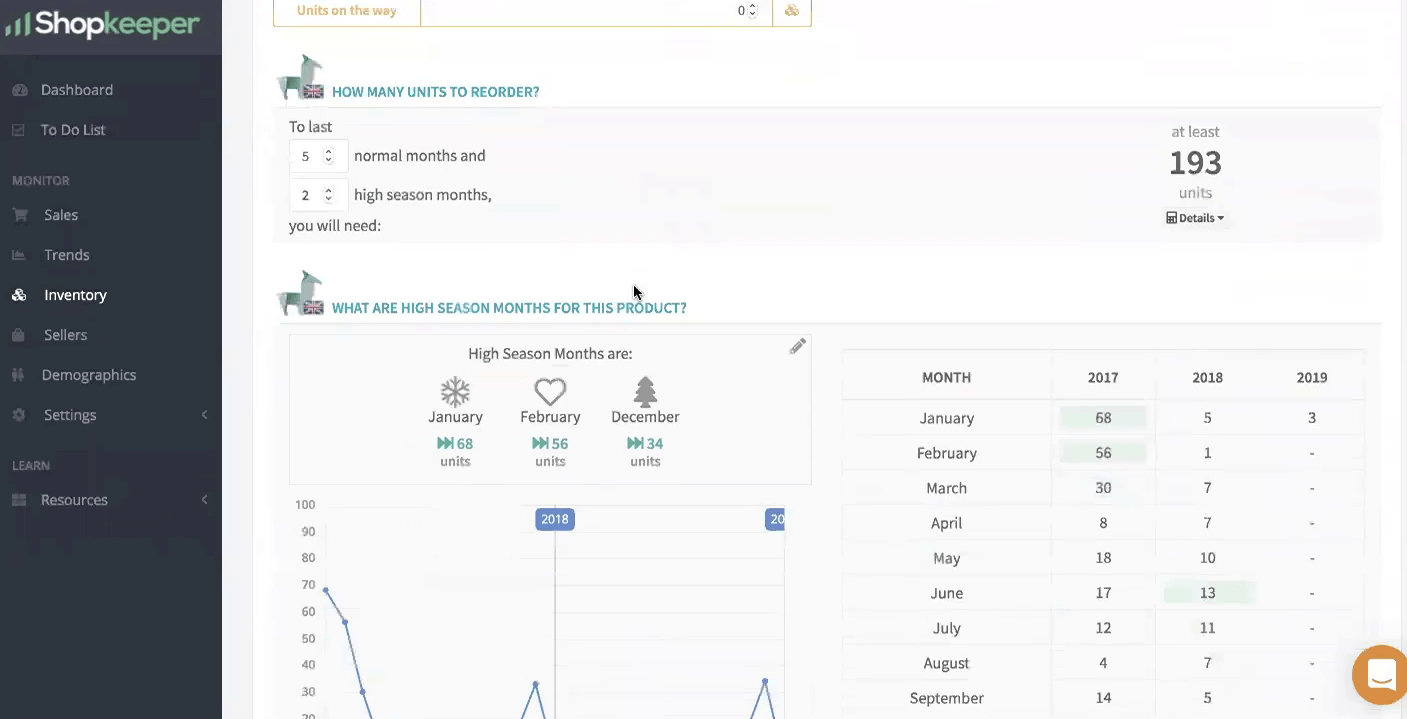
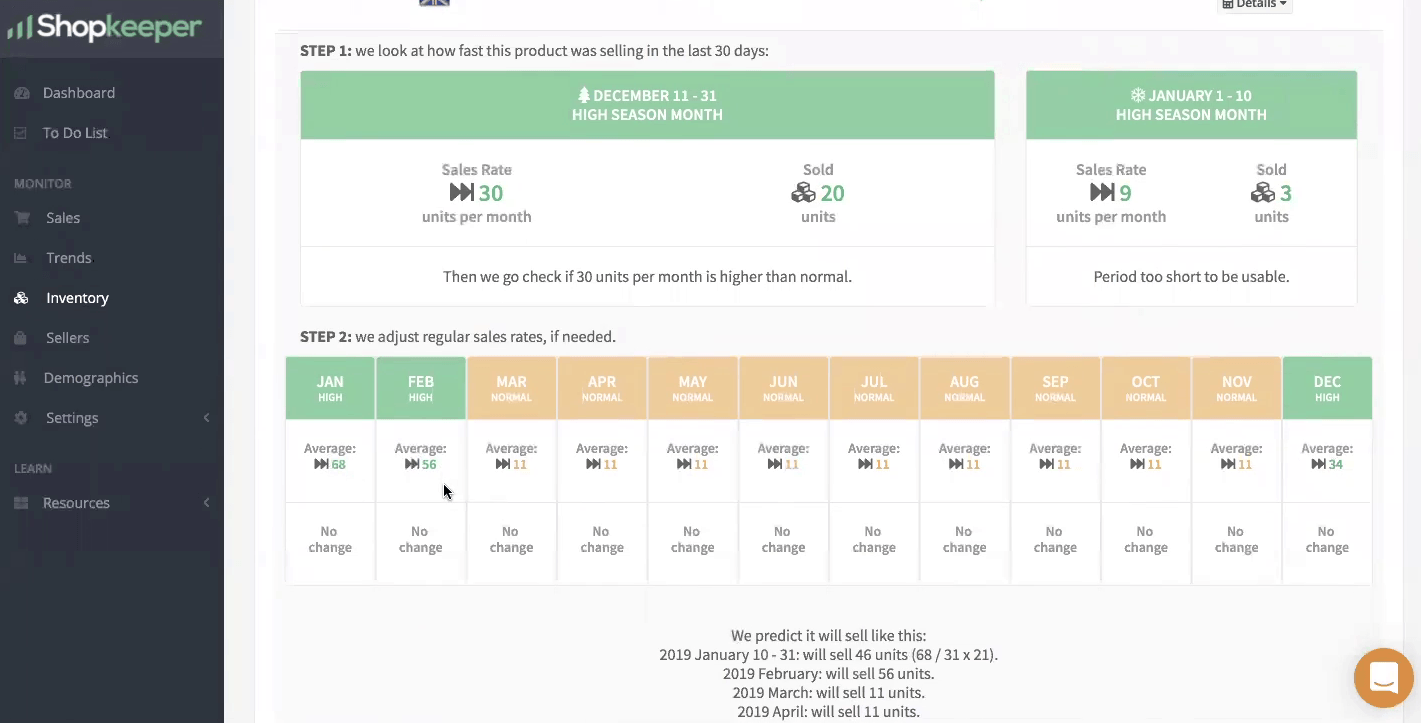
[26:57] Paulina: If you look at the details, you don’t trust this number. Good for 13 months. You can click on the details and see how exactly in which each month was calculated. Well, it’s saying that your normal months, the yellow ones are average 11 units are going to be sold and in a high season months is giving higher numbers that is estimated. So it does in fact take into account high season months for your product and tries to estimate properly for each individual month, how many units will be sold and you can yourself look at your data for the previous couple of years and just judge quickly whether the estimate is correct. So that’s how you can decide if you really want to pull the items. And in this case, I would definitely recommend pulling at least 200 units of each of these 2 items out of the inventory.
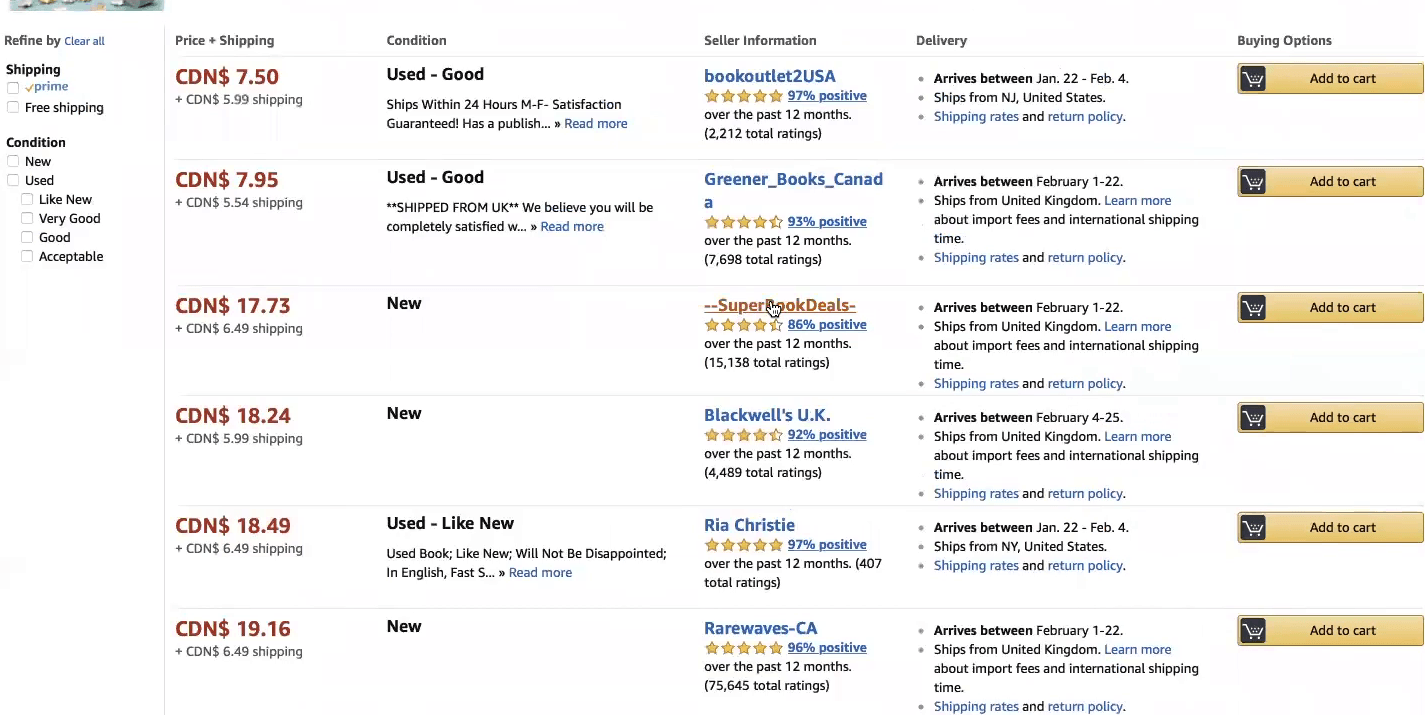
[27:51] Paulina: Let’s switch to another sidebar item. So it’s called sellers. This page tracks how many sellers you have on your private label listings, meaning that if you’re a private label seller, you are very likely don’t want any other sellers jumping on your listing and taking over some of your sales and some of your buy box. So you could come and see that there’s this mouse product which is actually in Canada, has 8 sellers, and you being a private label seller, you will be very disappointed with this number. You will click on view, and again this is just an example product, and you can see all the other sellers on the list that are actually selling the same product as you are. I would either counterfeit or maybe your own refunded item or something else. So you may want to submit and send them a contact message with a cease and desist letter to all of them.
[28:53] Paulina: And that could be another To Do item for you to add on your To Do list. So again, it helps you plan your day. You see every step we were doing within each of the sections. It always has some kind of To Do action item that you can decide as a business owner, I need to work on this, I need to work on that. And that’s why it’s much better than just seller central data, all these excel sheets. It immediately shows you just by doing a few clicks and looking at the numbers here and there, you immediately have To Do items, action items for your business. So that is very helpful. Let me show you what else you could do. You could for example, compare 4 of the different products, there is this one product that there are 4 different variations of it. So let me just add, I am typing in a key word which is common for all of the 4 variations. So it’s the same ASIN, and 4 different colors.
[29:57] Paulina: The images here are different, but in fact the product, the real product looks the same, only the color is different. And then you may want to turn off the totals row to see how the product was performing. So these are the number of sales each month. So you see that the green line and the blue line is actually doing much worse than the red and the orange line, except at this point the green and the blue spiked. Well, and then you can see that the red one and the orange went down. That means they ran out of stock and there was no sales of those and then people started buying this other colors and then once these other ones were back in stock and again red and blue went down. What does that mean is that it tells you that the blue and the green variations, the colors are not doing so well, so if you only have money to buy one or two new colors and you are trying to control your cash flow, you would really have to focus on these two on the best seller so it helps you to decide that.
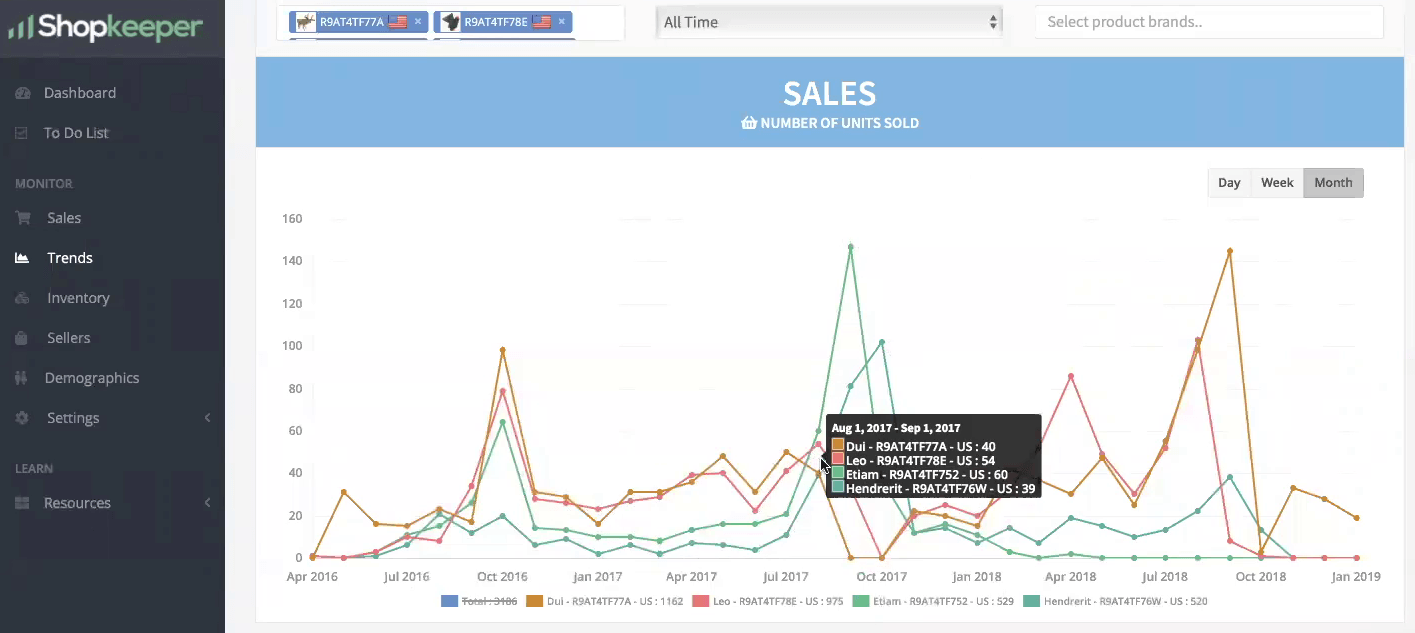
[31:04] Paulina: Another way to look at it would be so you could come here, say all times, we are looking at United States and again I’m going to enter the keyword that is common in the title for all these 4 variations and you see that in fact you have sold double of this one, double of that one, comparing to these two, so these 2 are not doing so good. Let’s expand all of them just to quickly see how many units we have left in stock. This one, only 2 units are left, this one nothing or this sold out and then this one already sold out as well. And this one has 225 units. So if you look at them now, you only, let’s say, have money to buy 1 color. How you are going to quickly decide which color to order, this one already have some things in stock and the chosen good for 7 months, just like I told you, it’s taking into account the high season and so on and so on.
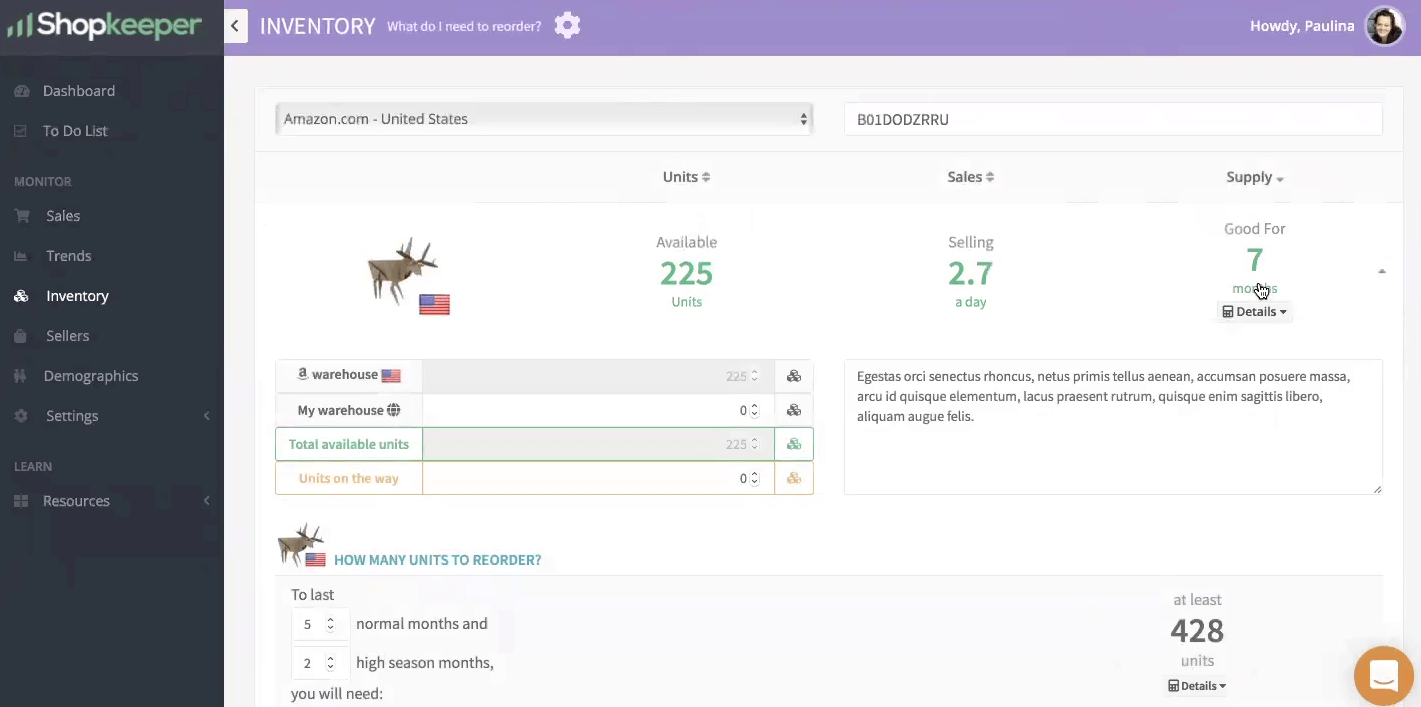
[32:07] Paulina: So this color is okay. You don’t need to order another one from that. But this other color is the next best seller, so this one was red and that one is the orange line. So that is immediately showing you that this one is the one that you could put your money on. So it’s a very nice way to compare the variations side by side by side. See their statistics and how they were doing in terms of refund rates. And in terms of profit and margins then comparing the number of sales in the transaction, you can compare your variations and decide which ones are worth to focus on and which ones you could eventually drop.
[32:49] Paulina: Before I end the demo, I would like to tell you one other thing, which is probably not what you expect in my demo, but there can be a day that you will be a little bit tired of your business or you might be having some creative ideas that you want to create and start something new and you might be considering to sell your business. So Shopkeeper can help you see what the current value is for the business when you would like to sell it. For example what you would do, you would take a date range that is exactly 1 year before today. So in this case we just change the year and we click apply. And then you would take the number that is the total profit on your account for that year and multiply it by 2. So in that case, it is roughly €30,000.
[33:44] Paulina: That means €60,000 is the base price that you could sell your business for. On top of that, you will get back some from your inventory. Let’s say this is the widget that you would look at inventory value at the moment you have 41 products in stock and that’s how many units you have there. You spent $34,000 on manufacturing and shipping and so on, and if all of these products would sell, that’s how much money you would get. So revenue would be about €80,000 minus all the Amazon fees. You would get a payout of €53,000. So that’s not all profit, but actually that is the real cash that is coming back to your bank account, if all goes well, if all sells. So €53,000 is an additional value that is in your business.
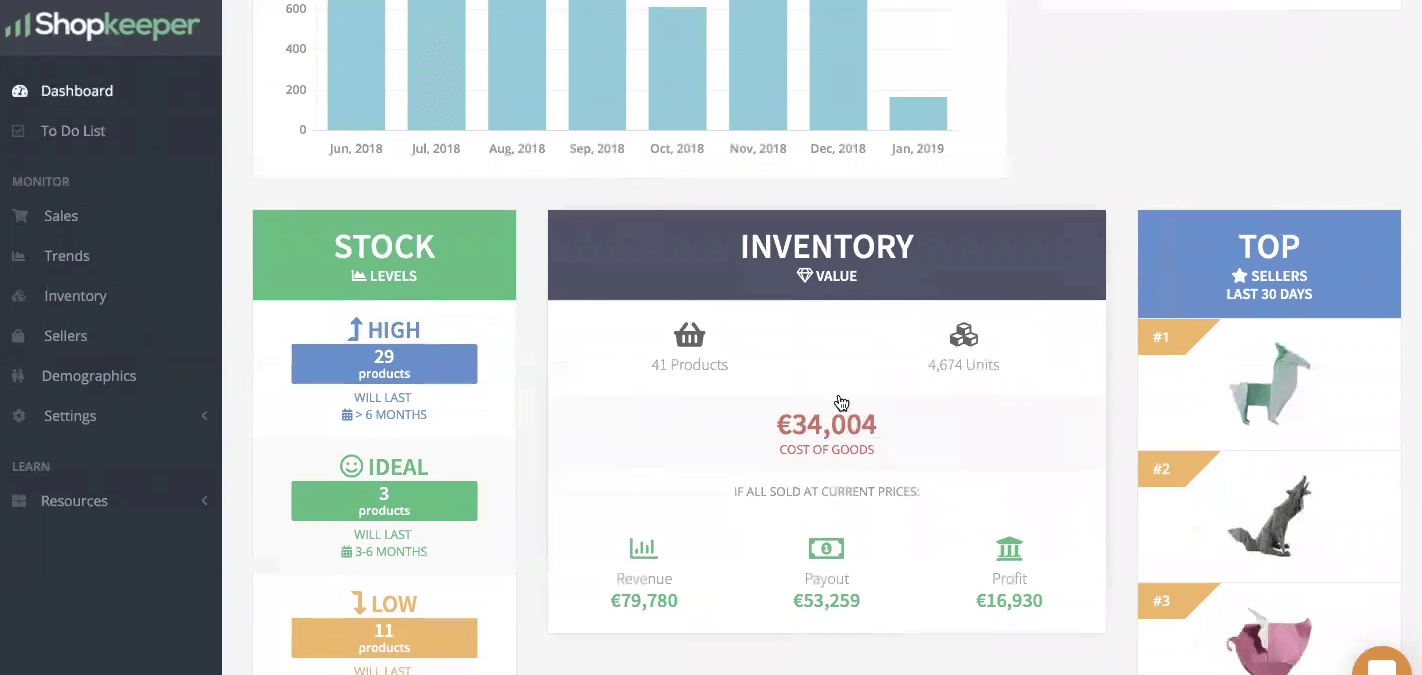
[34:46] Paulina: It’s just the value of your inventory. So these 2 numbers together. So it’s two times the last year’s profit and the value of your inventory is exactly approximate selling price which you could sell your business for. So in this case, I think if my math is correct, it’s €113,000 that you could be looking at. Of course there are so many other things that go into account. You know, if the trend is going up or down, if you’ve been a seller for more than 2 years, there are so many other things that brokers are looking for, but Shopkeeper can help you quickly judge how much money you would get, if you wanted to cash out today. So that ends my demo. There are some other fun things here you get the Ka-Ching sound every time you get a new sale. I know that especially new sellers have a sin and I have the same sin.
[35:42] Paulina: I kept checking and I come to the dashboard and I refreshed. Do they get any sales? I refreshed 5 minutes later and I refreshed 10 minutes later. So you just spend half of your day checking. Did you get any sales? So all new beginners have that sin and I am one of them. Shopkeeper helps you with that so you can quietly work in another tab and when the new sale comes in, there will be Ka-Ching sound and the tab will change, it will say 1 or 2 or 3 new sales. Then you can switch back the tab and see which sales were the new ones. So that’s pretty much it.
[36:17] Augustas: Thank you very much. Paulina. And can you tell us what features are you planning to implement for existing and future customers of yours?
[36:28] Paulina: Yes. So one of the most requested features is to be able to see multiple Amazon accounts within the same dashboard. So these are normally agencies who are taking care of more than one account or sellers who have a couple of different brands. So many big sellers not only have one brand with one account, but they have multiple accounts in the same marketplace because they have different companies that they registered and different brands, different trademarks. So for that they create separate Amazon accounts and many of them want to see all of that data into one dashboard together and that’s what we will be working on next. Combining all of that together, that’s the biggest feature coming up and there are many small adjustments because Amazon keeps changing how the API works and there are many inconsistencies in data and some, for example, old PPC data is not displayed. So we are working on the method to see older than 2 months data, even if you are newly joined user. So we would read that data directly from seller central. They are the extension of browser extension and things like that. So we keep constantly optimizing and making the numbers more accurate. That’s the goal.
[37:47] Augustas: Great. And let’s talk about pricing. What are the pricing tiers for using your software?
[37:56] Paulina: So it starts at $20 a month. So that’s for a beginner seller. And normally on average, our sellers pay $45 a month to us, so it actually changes automatically every month depending on the number of orders that you have. Because our system is doing a lot of processing on every order, it pulls the refunds for it, that goes reimbursements and check all of these data and also every few minutes it keeps thinking, Amazon checking if you have any new orders, any new changes and new things so the server load increases with the number of orders that you have and that’s why the price automatically jumps to another tier if you have more orders. If you have less orders next month, then the price goes down so like Christmas is finished and the next month you have much less orders and you automatically will pay less as well.
[38:45] Augustas: Alright then what is the best way to get in touch with your support team when somebody needs questions to be answered?
[38:57] Paulina: So once you go to Shopkeeper.com, in the corner you will see little orange bubble. So that’s a little chat that you can type any question you have in. Other alternative, you can also email us at support at support@shopkeeper.com .
[39:12] Augustas: Thank you very much Paulina and good luck in your business. Bye Bye.
[39:16] Paulina: Thank you Augustas, take care.