
sellerboard is an Amazon profit analytics dashboard and management accounting software for Amazon sellers. sellerboard takes all expenses into account, such as returns (including the cost of damaged returns), storage fees, long-term storage fees, inbound shipping, and about 70 other “hidden” Amazon fees and lets you drill down into every product, variation, fee and any period of time.
sellerboard features an inventory manager with automated restock alerts, an email campaign tool for review generation, and the “Money Back” reports which you can use to request reimbursements from Amazon for lost and damaged products. Recently, they updated their alerts notifications and PPC dashboard as well.
In this blog post, you will find a thorough overview of sellerboard as well as a few key features explained in more detail.
Sellerboard discount coupon code
To make it easier for you, we suggest using a discount coupon code DEMOMONDAYS when signing up for sellerboard. It gives you an extended 2-month trial. Click this affiliate link to visit sellerboard website and sign up.
 First 2 months for FREE
What is sellerboard?
Mainly, the tool is suitable for Amazon FBA (Fulfillment by Amazon) sellers.. It’s just because calculating the profit when you’re doing FBA is pretty tricky – there are a lot of different fees, like storage fees or inbound shipping fees and stuff like that.
Most of sellerboard’s users are doing FBA. Some of them, however, do not only do FBA, but also do FBM. So a lot of sellers are starting to fulfill products by themselves or participate in programs such as Prime By Seller. This is why they’re doing both FBA and FBM. There are also sellers who are doing drop shipping or online arbitrage. So, basically, there is no restriction for the kind of business that works the best.
Also, it’s not just about profit analytics, it’s really about putting you into a position to make a better business decision based on data. And, of course, the main indicator is the profitability. Seller Central, as we all know, has a lot of statistics and a lot of reports, but it’s pretty hard to determine what you actually earn, especially in real-time. So there is a way to download a couple of reports and merge them and do some Excel manipulations to calculate your profit.
The software targets every seller — from the beginner to the most advanced. Of course, if you only have one product which you’re selling maybe 1 or 2 times a day, it doesn’t make a lot of sense to invest in a profit analytics tool because it’s pretty easy to calculate your profit yourself. But if you are getting a little bit more sales or if you’re getting a second product or maybe even different variants, then it starts being pretty tricky and costs a lot of time to calculate the profit. So it makes sense to check out a couple of profit analytics tools, and this is where sellerboard comes into the play.
How to get started
First of all, what you need to do when you register you need to authorize sellerboard to access your Seller Central. It’s basically a very easy process to do – all you need to do is to click one ink, which brings it to Amazon. And then you must confirm that the third party application, in this case, sellerboard, is a registered developer at Amazon and is allowed to access your data.
Once you’ve done that, sellerboard starts to load the data. It takes a couple of hours and it takes your sales data for the last 1 year. However, if you have a very large account, then it might be limited to 6 months, but normally it’s 1 year.
Sellerboard alerts
sellerboard lets you know of all changes in your listing by sending you alert notifications. You can easily see all new notifications in the sellerboard dashboard, by clicking the bell notification icon at the top right corner:
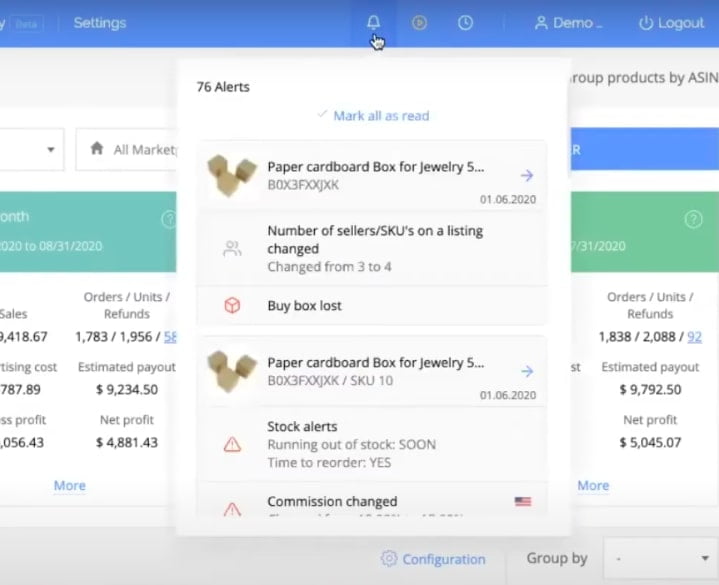
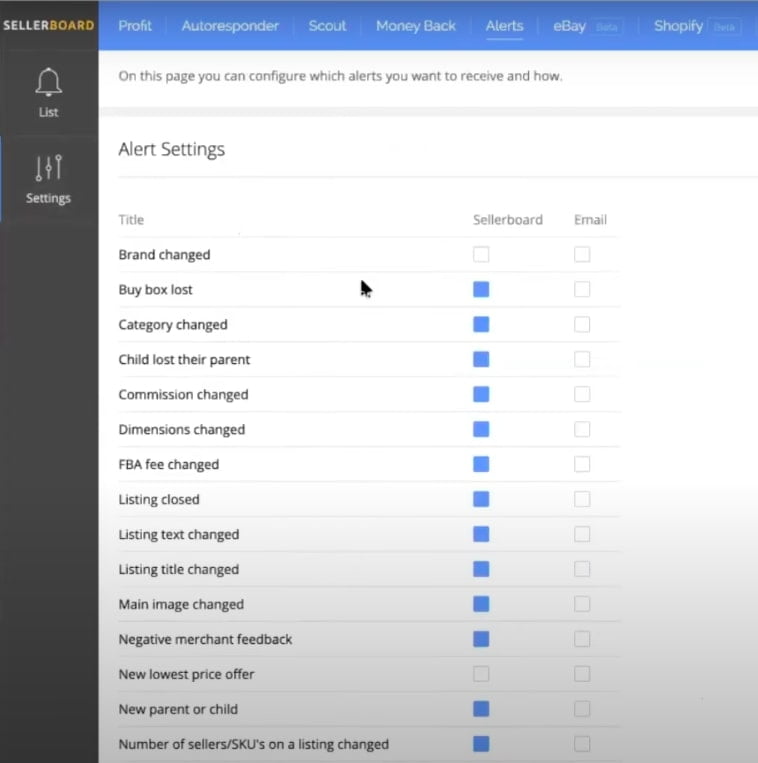
Your can configure for which changes you want to be notified. For example, you can get notifications when:
- Brand changed
- Buy box is lost
- Category changed
- Commission changed
- FBA fee changed
- Listing closed
- Dimensions changed
- Listing closed
- Listing text changed
- Listing title changed
- Main image changed
- New lowest price offer
- Negative merchant feedback
- New parent or child
- Number of sellers/SKU’s on a listing changed
- Stock alerts
So by checking the box in the first column, you get notified within the sellerboard tool and by checking both boxes, you will also receive an email informing about the new change:
Here’s a quick tutorial on how to enable the alerts feature inside the sellerboard dashboard.
Shopify & eBay integrations
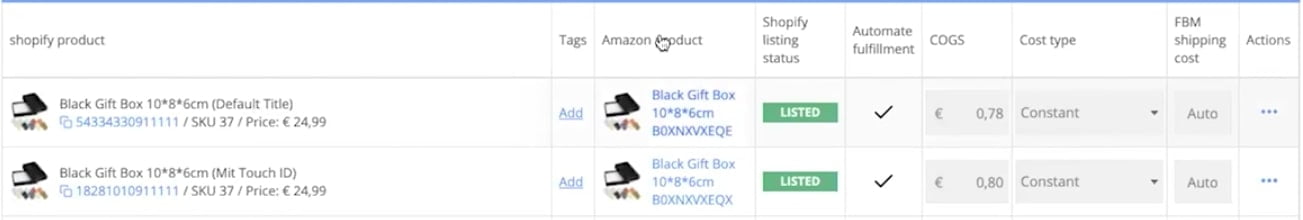
There are many Amazon sellers who also sell on Shopify or eBay. For this reason, sellerboard created a feature that allows to track all sales data from different channels in one place. The interface is quite similar to what you get by using sellerboard for Amazon sales. Basically, if someone orders your product on eBay, sellerboard sends this product through Amazon multi-channel fulfillment. So sometimes you might notice “FBA fulfillment fee” on your eBay sales data.

To create a multi-channel fulfillment, on the products tab, connect a certain product to Amazon SKU. Then sellerboard will automatically calculates the shipping costs.
Also, check out the video below to find step-by-step instructions on how to use it.
sellerboard PPC dashboard
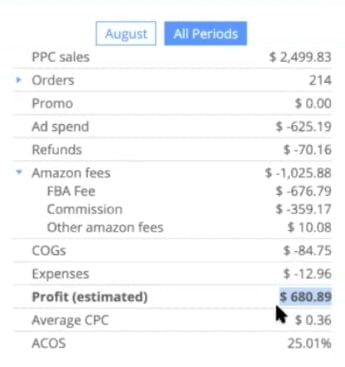
In sellerboard’s PPC dashboard, you will see your Amazon PPC campaign profits by calculating your daily ad spend and profit. On the right side, there is a complete breakdown of your PPC sales:
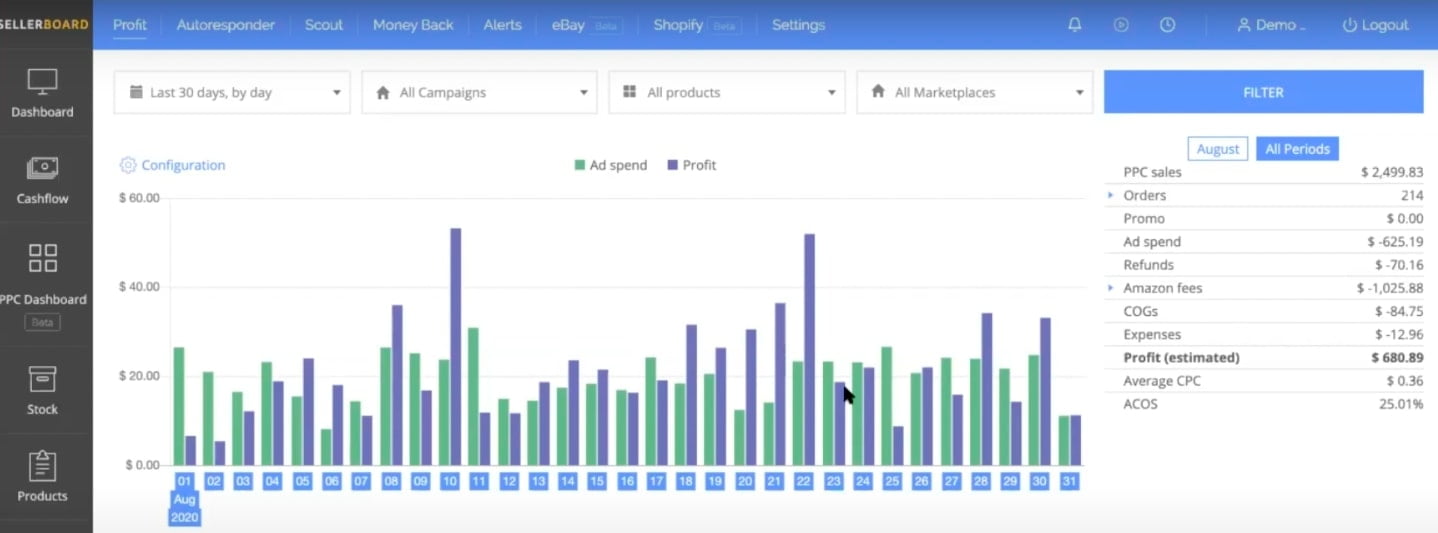
Amazon won’t give you all sales data related to PPC, neither in Seller Central nor through API. We can see how much profit we make through PPC campaigns, however, you don’t know which products you have sold. Because of it, those numbers in sellerboard’s dashboard are estimates, that’s constantly being calculated by the algorithm.
As a result, you are given the estimated profit that you made from your PPC campaigns:
A bit below, you will find your PPC campaigns listed. You can find out, which Amazon PPC campaign and even keyword generated you most of the sales.
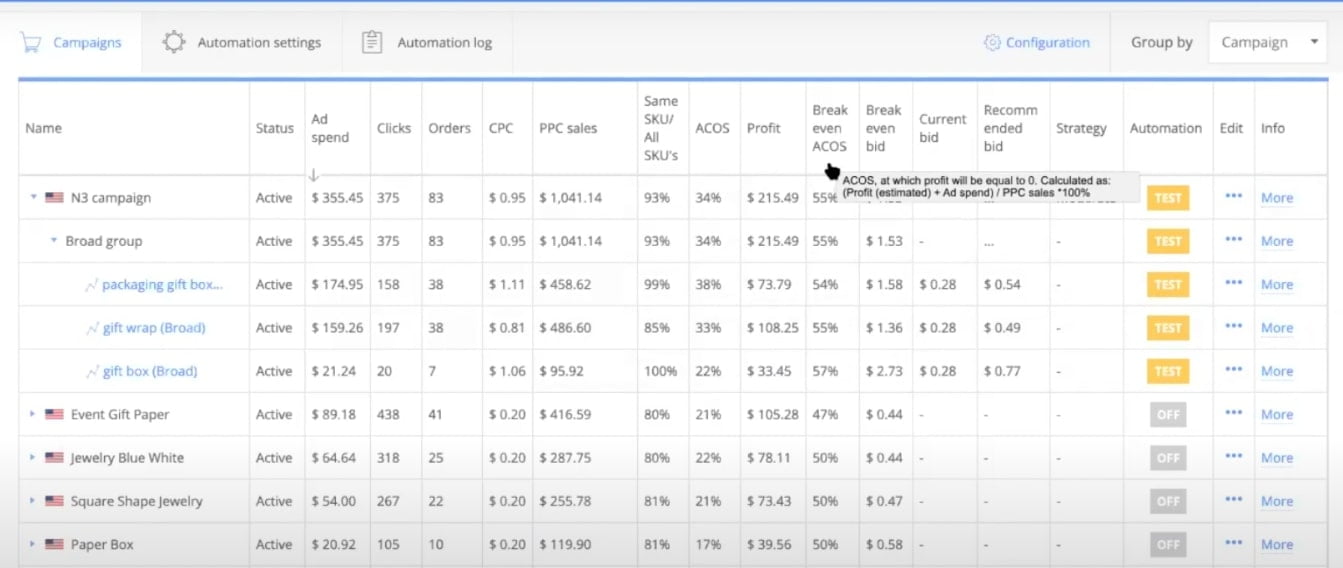
Besides that, you will find your ACoS data, CPC, and recommended bids.
Recommended bids are actually automated. All you need to do is to click on “Edit”, turn the automation on, and let sellerboard calculate your bids. It won’t apply to your products automatically though – this is what you need to do by yourself.
sellerboard Amazon dashboard
When you’re set, this is how the entry screen looks like. Basically, this is an overview of your profit and loss in real-time.
On the top, we have the tiles, we call these things “tiles”, and you can see a quick overview of how you’re doing basically today. How was your day yesterday? How is this month going? And compare it to sellerboard’s forecast and also compare it to the last month. And regularly this set up is configurable. You can pick different sets of these tiles here or also configure any period of time.
Anybody can go to sellerboard and click the “Demo” button and then view this account. Keep in mind it’s not a real data — this is marked — but they made it look a little bit real.

The nice thing about this sellerboard dashboard is that you can dive in and drill down into every number and basically into every marketplace into every product.
For example, if you click on “This Month”, then here on the bottom, we get the list of products that we sold this month. We can see that the “Net Profit” was €1,600, and again, this is euros because this demo account is in Europe. But of course, this works also in dollars or in British pounds if your home marketplace is Britain. So if I click on “More” here, then we the exact situation for this period of time. So in this case, this was this month, so how many sales we had, and this is split by “Organic” and “PPC” sales.

Refunds and calculating your profit
For example, you sell a product in March. Then 2 weeks later, the item gets returned. So normally, when you calculate your profit for March, you need to consider or account for this item sold that was returned later, right? Maybe it’s even returned after you already calculated your profit for a month and made some decisions based on this.
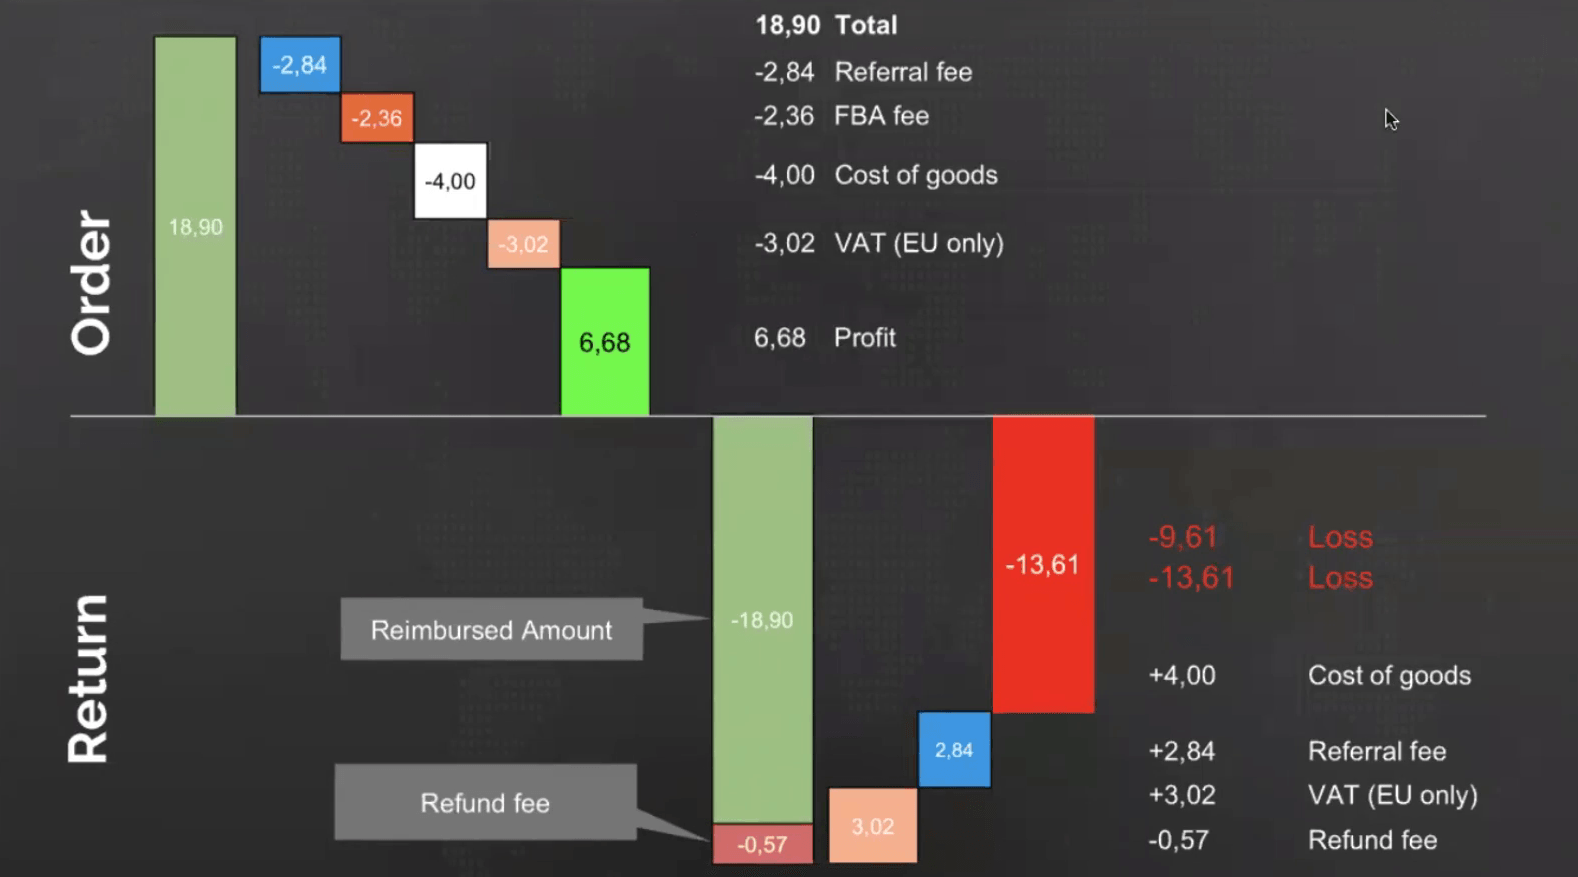
So what needs to happen is, really, when a return comes in in April, then we need to correct or subtract the cost of this return. By “cost”, we mean the cost of the product, if it was broken, but also the fees that are not getting reimbursed or the fees that are applied to the seller when the returned item comes in. So we need to subtract all these numbers from April’s financial result because, effectively, a return which came in April makes our profit in April smaller.
So first, we take the reimbursed amount, because when a return is initiated, Amazon immediately reimburses the whole money to the customer. Then, a couple of things happen. So for example, a customer sends the item back into the Amazon warehouse, Amazon opens the package, the return package, and unpacks the item, and decides “Is it good or is it broken?”
And then, there’s things like “Refund promotion” or the commission. So basically, this is a nice one. If we sell a product and Amazon charges us a 15% commission and the product gets returned, then Amazon returns this 15% commission to the seller.
And last but not least, are the “Product costs.” Basically, what happens is the following: if the customer breaks the product or maybe unpacks it in a way that it is not sellable anymore, then we need to account for the cost of goods or for the cost of this item.
However, of course, not all products are sellable when they come back. Sellerboard automatically evaluates this and looks into every transaction and see if Amazon decided the product is sellable or not, and kind of reimburse this number in the calculation. So all in one, you have a number, and this is roughly about €300 here, and this is what returns effectively cost us this month (see the screenshot above).
Refunds and calculating your profit
Profitability analytics
So the next thing we would like to show is a drill-down into the product. Once you click on one of these tiles, the list here on the bottom is updated. And you see how many units you have sold.t
We can also “Group by parent” here. So if you want to see how many sales and how much profit you made by-product regardless of which variation you sold and others, this is possible here. But whether you do that or not, you see the unit sold and the number of sales and in the end, also the net profit, the net profit contribution of this exact SKU.
And if you click on this “More” link, then you will see basically the same detailed overview of all the different fees and refund costs and Amazon fees and stuff that we just explained, but only for this one particular product.
So as you can see, we can drill down into every single SKU and inspect every kind of fee and to see, for example, “Okay, maybe I got too many refunds on this one. We can do something about it.”
We’d like to show you a couple of more things on the dashboard basically because this is the main instrument that our customers are using. sellerboard wanted to give them multiple opportunities to do their business intelligence — sort and filter and visualize this in a way that is best to make some business decisions.
So for example, we have a filter here, and you can filter this view by one or multiple products, or you can even search here by name or by tag, and then select the product or the products that you’re interested in.
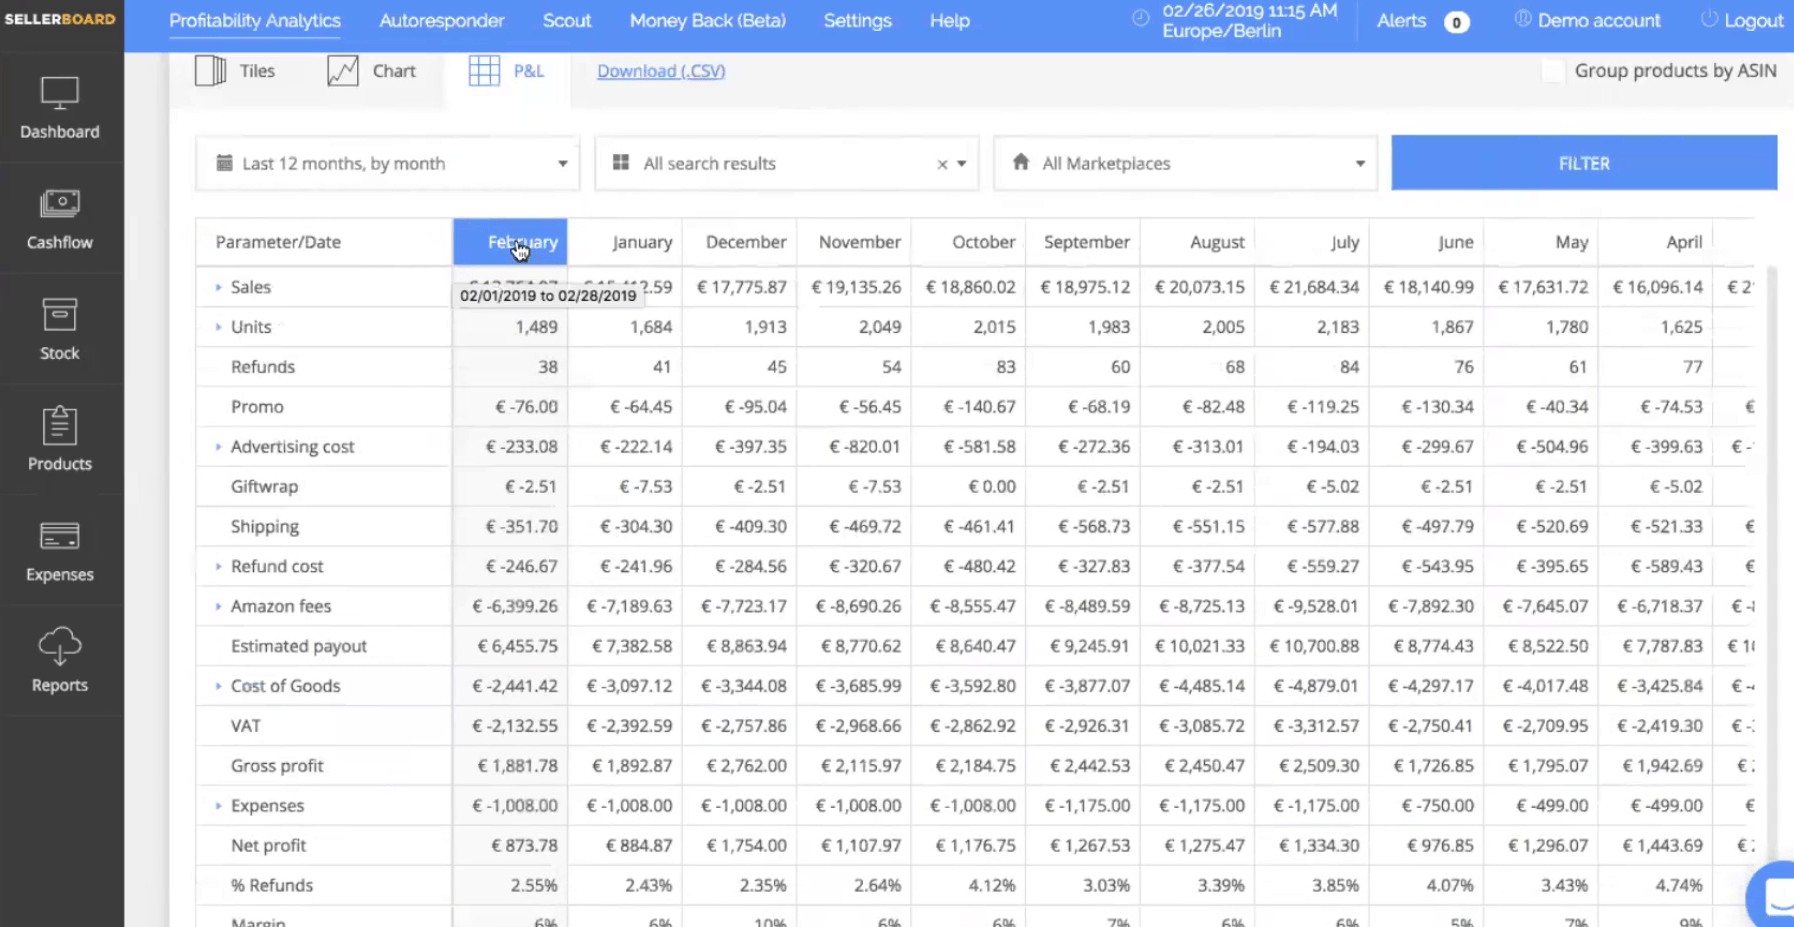
Profit and loss dashboard
And the last but not least, the representation here is a Profit and Loss table. Basically, the data is the same but the view is a little bit different. Here all the numbers are presented in an interactive table. And also here, our vision was to display aggregated data on the top, and specific data — so basically, data by SKU or by a product — on the bottom. So every column in this table is clickable.
If I click, for example, in December, then the day down the bottom will be updated and we’ll see all the products sold in December. But we also can apply the same filters as before. And here, all the different positions are expendable, so you can see really like what were your fees. For example, here’s the “Warehouse Damage” position, “Lightning Deals.”

You can see what were the Lightning Deal expenses per month, for example. In September, we had a couple of Lightning Deals, but no more lightning deals [on other months]. This is pretty much it for the Dashboard.
You see we have three different representations and a lot of different filter criteria and a lot of ways to aggregate the data by month, by week, by day, and yeah, pretty sophisticated, drilled-on possibilities. So basically, what you need to do to get meaningful numbers in the Dashboard, especially the correct profit, is to enter your buying prices. Of course, we can only calculate the profit if we have the buying prices or the cost of goods. And that, you can do here under the “Products” tab.
It’s your loss now and then it’s the cost of goods, and these are two numbers in my example with cost of goods or without. So depending on whether your product is sellable or no one gets returned, you lose this money or no, and which you also lose of course is the FBA fee because it’s not reimbursed.
One more thing that you can dive in here is the Amazon fees. So you can see you paid more than 7,000€ in Amazon fees. And if you open this, you can see exactly what those are. For example, the storage fee, is also often neglected by sellers because it’s not shown very prominently in the seller central.
Expenses
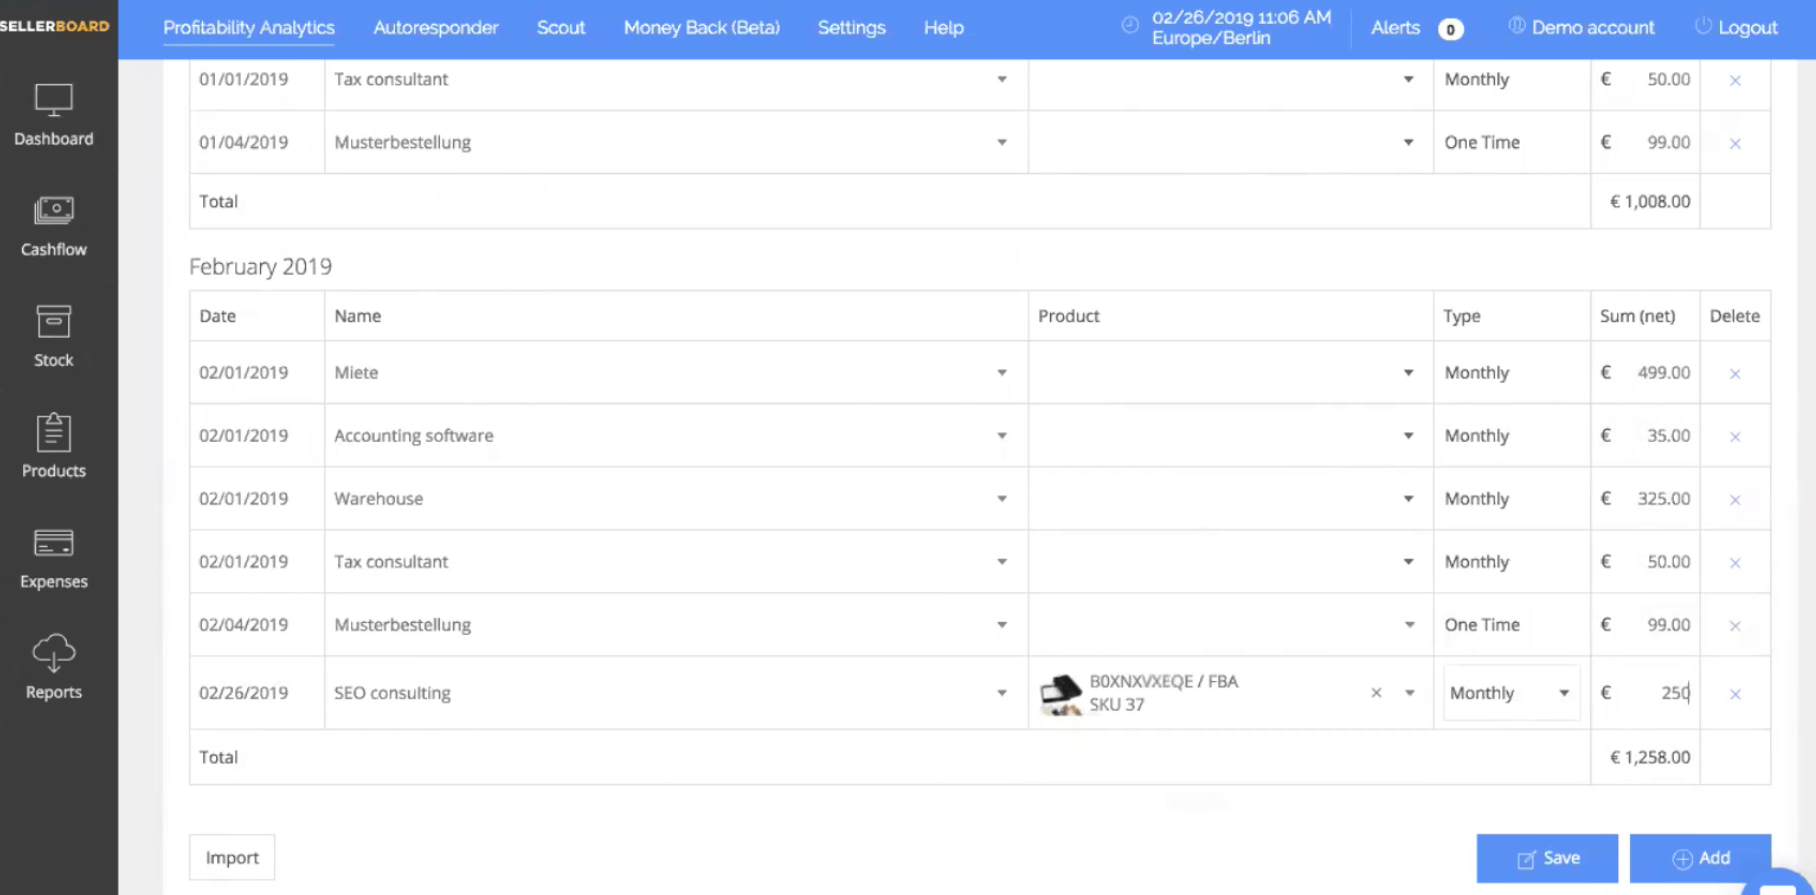
Sellerboard has a tab called expenses and basically all the Amazon fees they import automatically, but you can also add things like software or if you have your own warehouse or a Prep Center and then you can add your warehouse. So if you add those things under expenses here, then it will be basically factoring them in and showing them every month or every day, depending on how you entered them.
First 2 months for FREEBasically, what you can do is you can add an expense and can give it a date, for example, like the February 26th. And then, if you want, you can assign it to a certain SKU.
If you do, basically it will show this expense by product and the dashboard and then you can select whether it’s a one time expense or a monthly. And if it’s a monthly expense, let’s say it’s like €250 a month, then it will automatically edit into every new month.
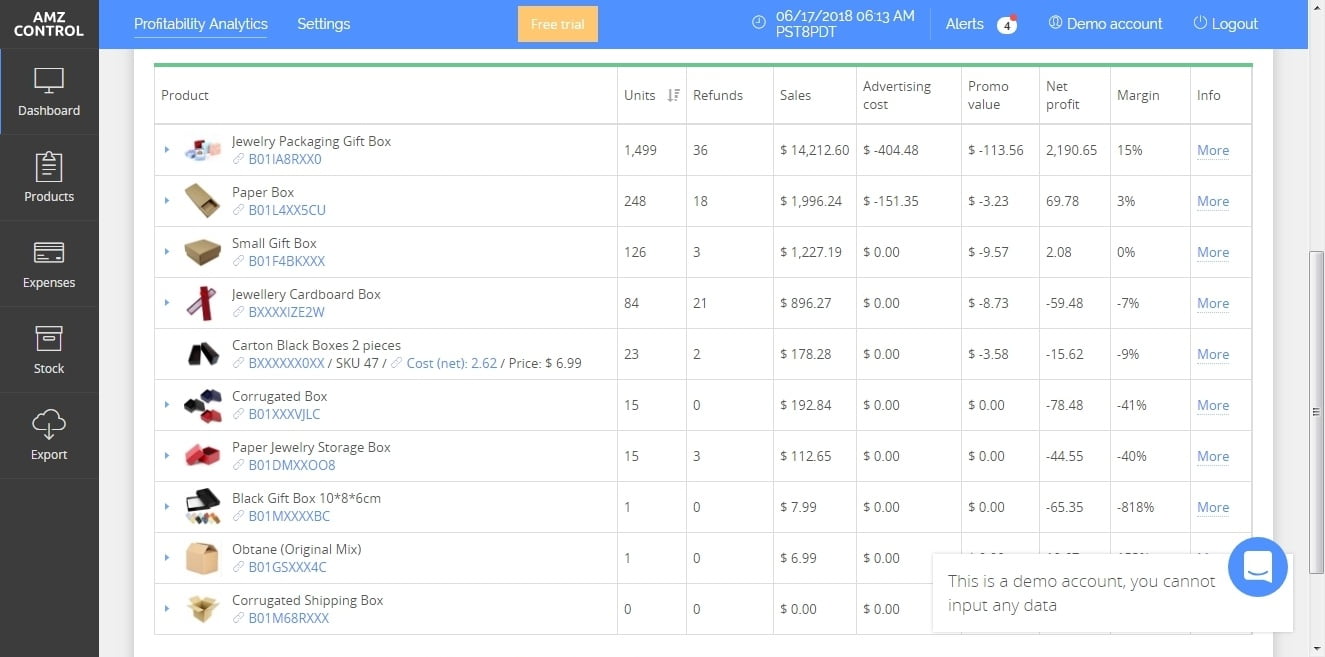
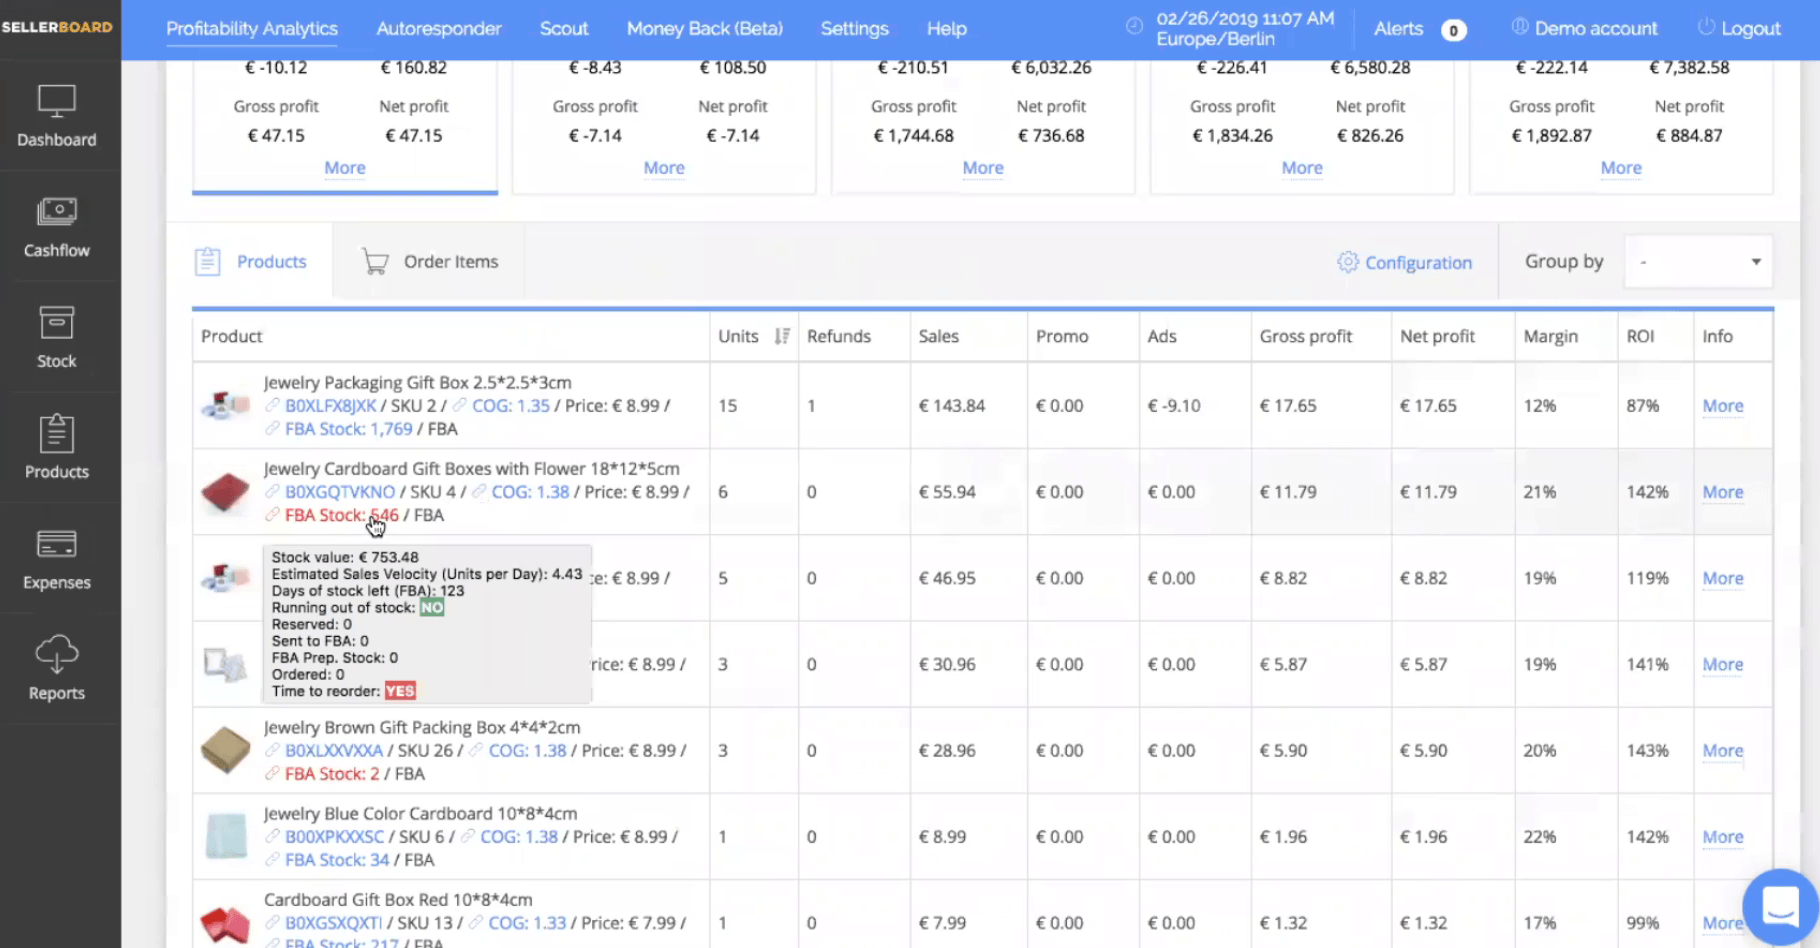
You can view your products and for every product exactly you can see how many units you sold, how many refunds you had today, what was the gross profit and what’s the margin, and the ROI of this product. So you can, for example, sort by ROI. ROI is actually more important than the profit margin.
Also, if the unit is running out of stock, we have a stock module on the dashboard. If it’s red, you can hover over this item and you see a thread that will show you the summary of the stock, and, basically, the stock module allows you to enter your production time and shipping time from China to your prep center (if you have one) or directly to Amazon.
Then the tool will generate, reorder, and restock modifications. You’ll get a notify in case it’s time to reorder this product.
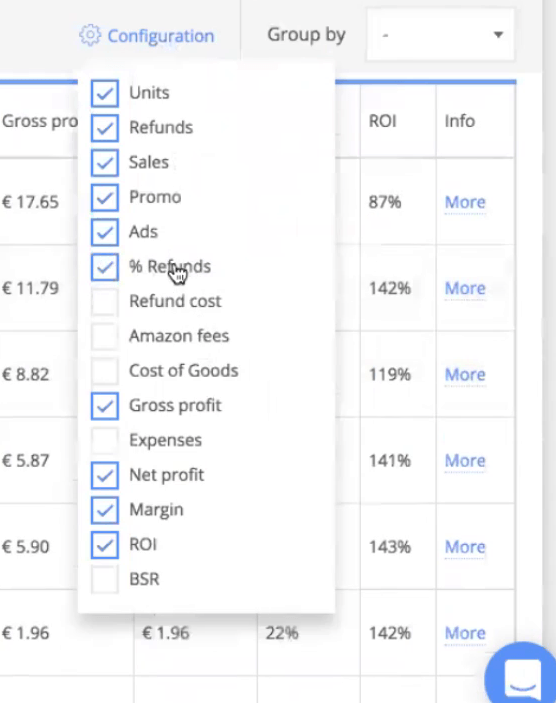
What else, is that you can configure the columns, for example, an important parameter here is percentage of refunds. You can activate the percentage of refunds and track it.
For example, if you have a product with 13% refund rate, that’s very bad. So make sure you watch this KPI and if it gets suspiciously high, then do something about it, go to your seller central and check what are the refund reasons.
In the report section under FBA, and there you can see the reasons why the customer refunded. So make sure that everything’s right with your product.
Grouping products inside sellerboard
One more thing that we’d like to talk about is the grouping. You can group your products by marketplace, for example. And then what you get is basically get your numbers by marketplace so you can see how many items you have sold in each marketplace.
In Seller Central, you can also switch between marketplaces, but you can’t see them all together. Using sellerboard, you can see all marketplaces and have an overview in one list.
The tool shows the data for every marketplace, how much did you sell and what were the ad costs, what’s the percent refunds and what’s the ROI of this marketplace. And if you want to drill down into the detail, click “More” on the right side of the dashboard and you can see every single Amazon fee on this marketplace.

If you have a couple of private label brands, then you will see the situation here by brand – how many units you sold, what was the net profit of the brand, and what’s the ROI.
You can pick any period of time here, but you can also filter the data by product. It’s common to use labels for that, so you can only filter our the products in the dashboard that has the same labels.
Profit by products
Here we have a chart where every month is clickable. You can click on whatever month and then on the right side you see your profit analytics:
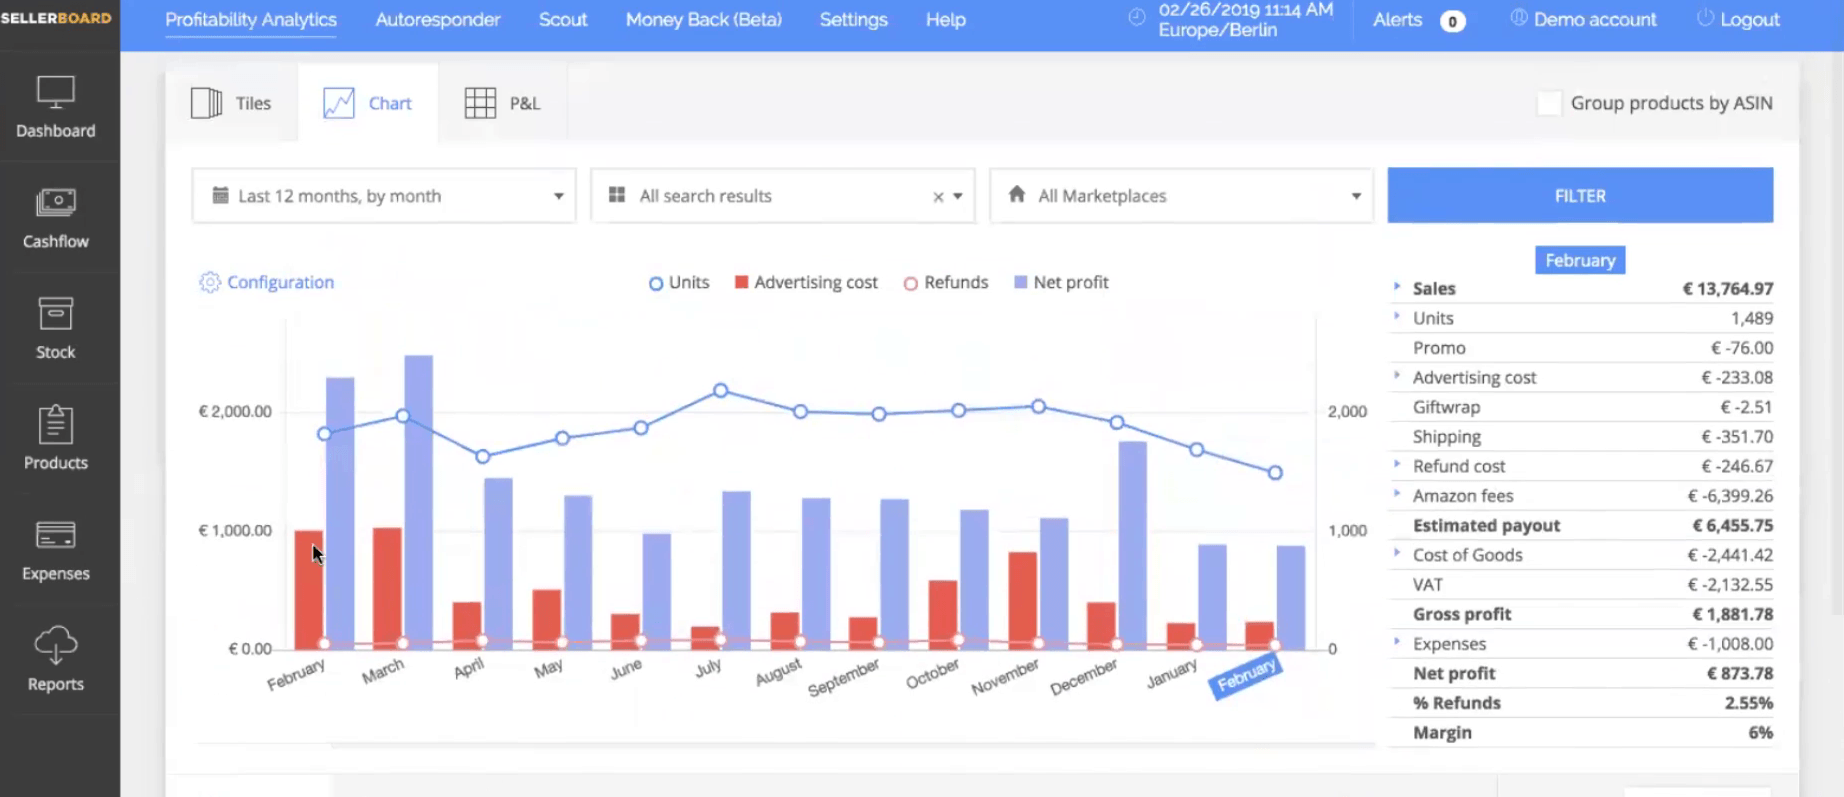
All the fees are broken down by old fees and also here it can drill down into every single one of them. This way, basically, you can drill down to every period of time. And this chart is configurable, meaning you can choose which data you want to be displayed.
Last but not least, the third one is a P & L (Profit & Loss) table. So here again, you see the same data again, but now structured as a table. And this is also a smart table, so every item on this table is clickable.
You can again expand results, like Amazon fees, for example, and see all kinds of fees and compare it with the storage fee month by month, for example.
In the example below, we see the storage fee here or subscription is obviously always the same on the inbound transportation or the disposal fee. If you click on any period of time here, you can drill down into products, group them any way you want.
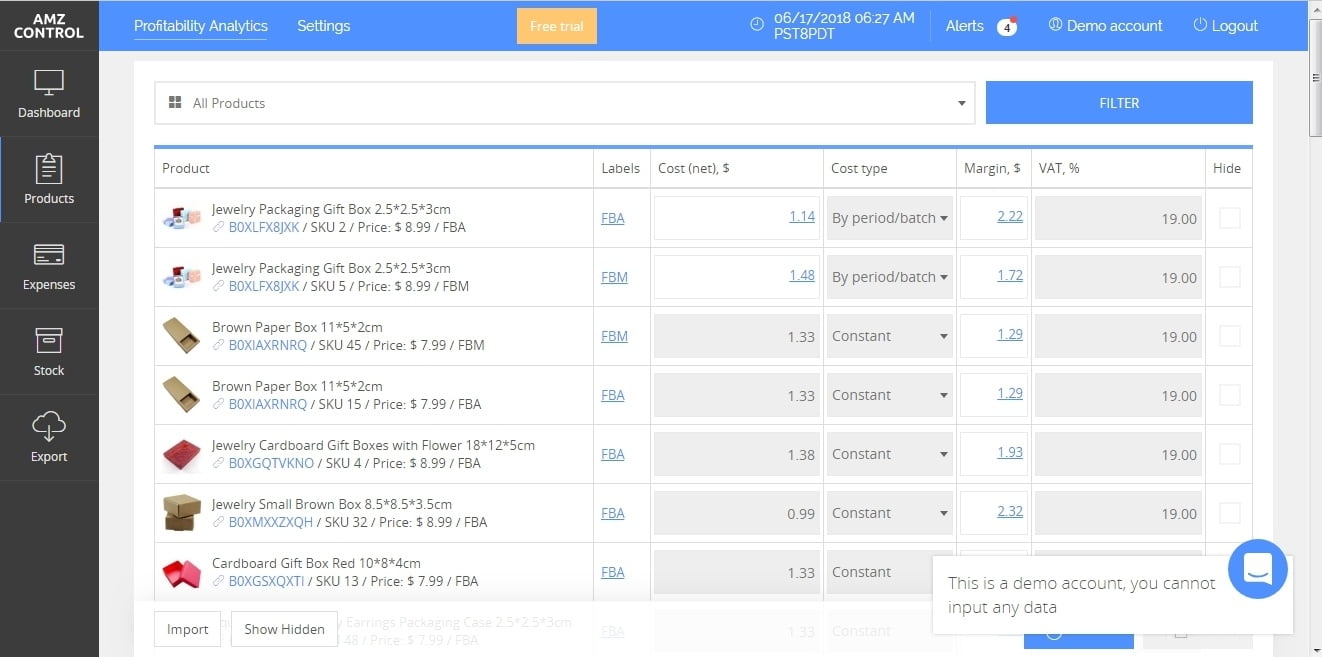
Adding cost of goods
So now let us show you how you enter the cost of goods for the products. Basically, you see all the products and their cost of goods. You have 2 ways to enter the cost of goods: 1) do it as a constant number (i.e. the box costs €1.79, and whatever you enter, will be applied to the whole history). If you change it now, this number will still be applied to all the orders from the past, but sometimes you have a situation where your cost of goods are changing over time because you get a different price from a supplier or shipping costs are more or less than the last time. So the second way of adding the cost of goods is to enter your cost of goods by a period of time or even by batch.
By choosig a type called “By period batch”, you’d get a popup dialog where you can enter your cost of goods. Basically, what you do is you can enter all the components of your pricing, like the manufacturing, the shipping, inspections, things like this. And you can enter the price per unit or price per 1000 units.
For example, if you shipped 1000 units and you just enter a higher number here, like €350 for 1000 units, the tool can calculate your total number or total cost of goods. And here, it can pick different time periods.
And there’s one more thing here called the “Account for the remainder of stock from the previous batch”. In a nutshell, this way we can basically take an account whenever you have left from your previous order. So this way, you have the 100% precise cost of goods starting on this date. If you click it, you can specify the pricing and it applies to your new batch.

To put it shortly, you can enter your cost of goods by period and also by batch.
And if you change this, this will also affect the orders retrospectively — so basically, orders that were six months before or two months before. And here, we also have a little Margin calculator. It shows you, “Okay, with this product, this is how much we earn.”
However, please be aware that these are just estimates. Actually, sellerboard works this way: they really take a look into every single transaction, download your transactions report and look into every transaction and calculate what was the selling price and which fees you’re actually charged or you were actually charged by Amazon.
Then they sum these up and apply the buying prices, then we know the profit. So we don’t calculate the profit or the margin for one sale and multiply it by the number of sales — we actually take a look into every transaction. And this is important because the selling prices are changing and the buying prices are changing, so we want to know it really precisely.

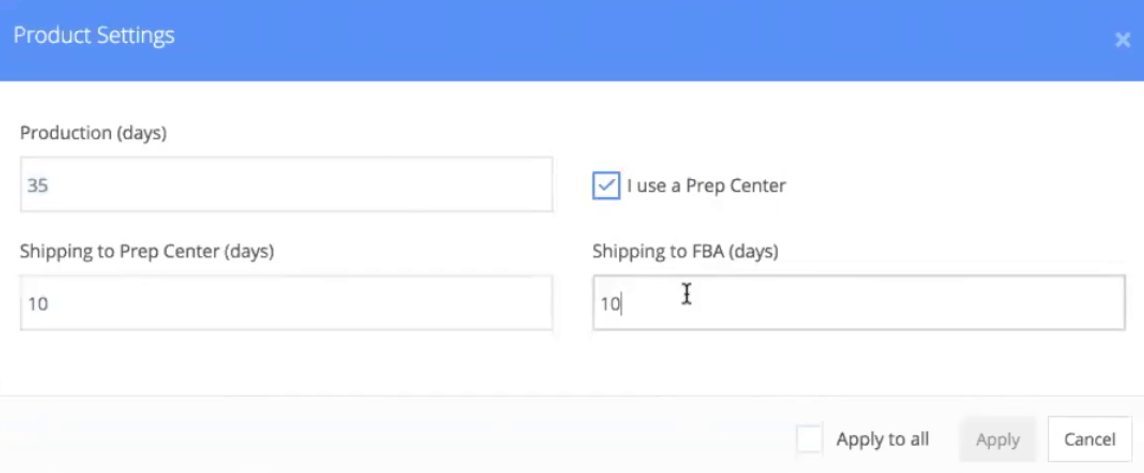
Tracking your stock
Sellerboard tracks your stock and generates reorder and refill modifications. It can also show you the value of your stock. So how much money, basically you have locked in, in these items. By calculating it, the tool estimates your sales velocity per day and if you click on it, you can configure it the way you want.
Let’s say it takes 35 days to produce the item and then it takes 10 days to ship it from China to your Prep Center because maybe you’re using air freight and then you want another 10 days extra. If you don’t use the prep center, then you can just unpick the box and choose to ship it directly to Amazon warehouse. And then it’s only these two settings.
If you want, you can apply these settings to all of your products. But you can also change them individually because different products have different production times.
Sellerboard also lets you know when you need to reorder before it’s too late. However, let’s say only 10 items are left in the Prep Center, but you already placed an order, then the tool won’t remind you that it’s time to reorder because you already ordered. So this way it tracks your sales and tells you when it’s time to reorder. This is very important because Amazon tells you when it’s time to refill the products, but mostly it’s already too late by then.
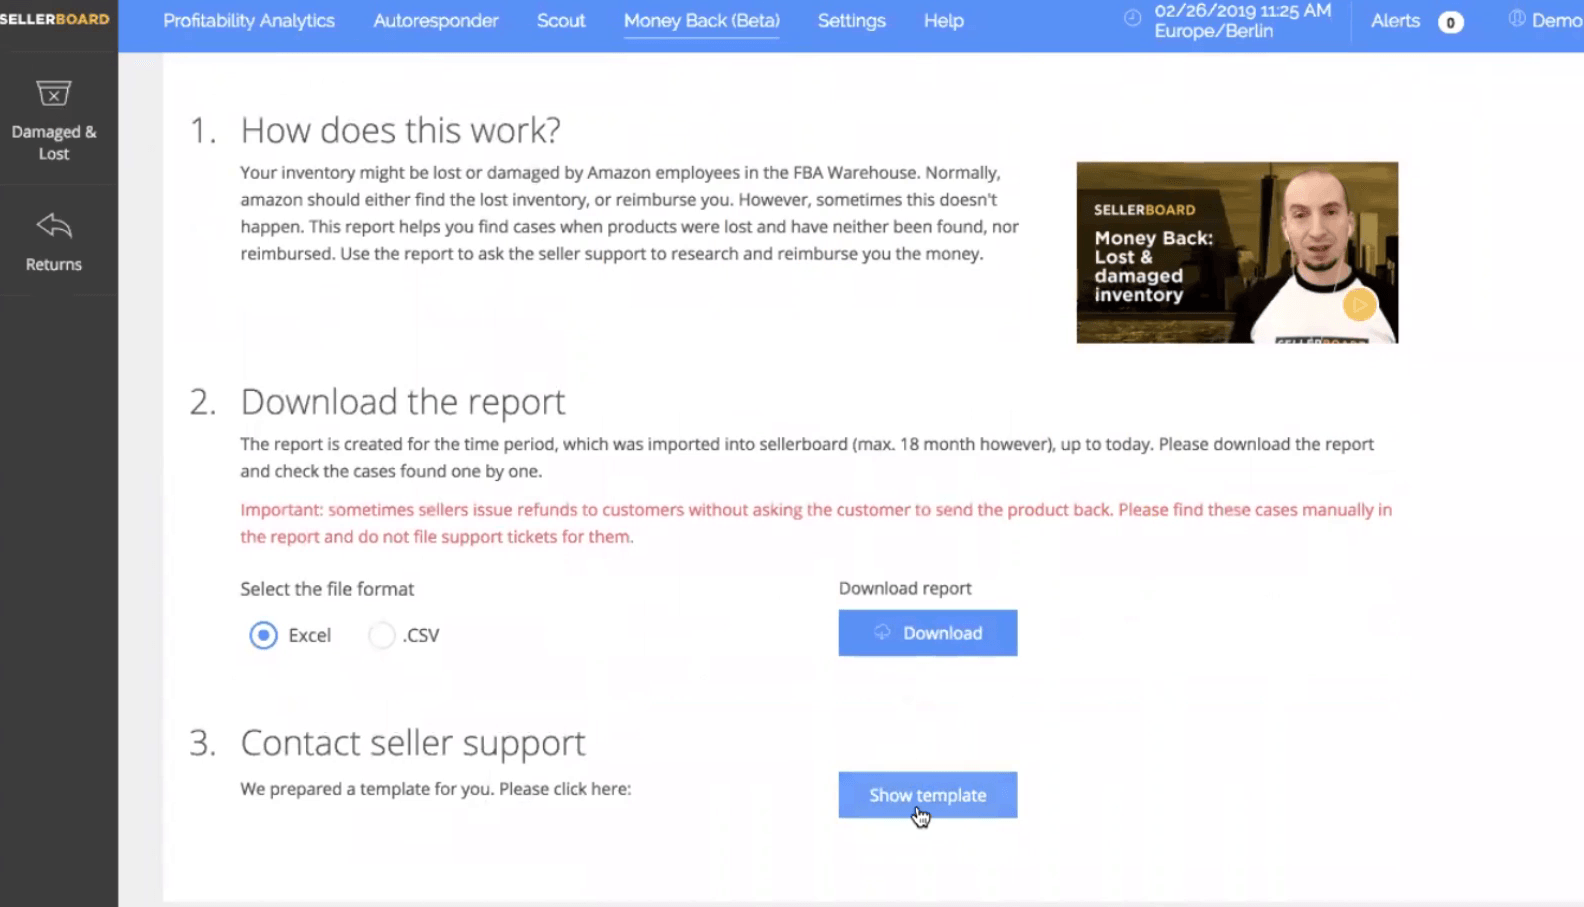
Money-back reports
Basically, you probably know that sometimes Amazon is losing your inventory or damaging your inventory or sometimes there are returns that a customer get reimbursed for, but they never actually return the item.
In these cases, normally you get reimbursed by Amazon. So if they damage 100 items, probably like 90%, 95% probability they will reimburse for them. But sometimes something happens in the FBA system and you don’t get reimbursed and you can search for such cases and then create support tickets. And that’s exactly what money back reports are for.
When you think Amazon owes you money and there’s an instruction here, in a short video explaining how to get this money back. So basically all you need to do is you need to download the report from here. It’s an excel file and this report will show you ASIN by ASIN how many items are missing.
Autoresponder
Auto-responder is basically an email campaign tool where you can configure email campaigns.
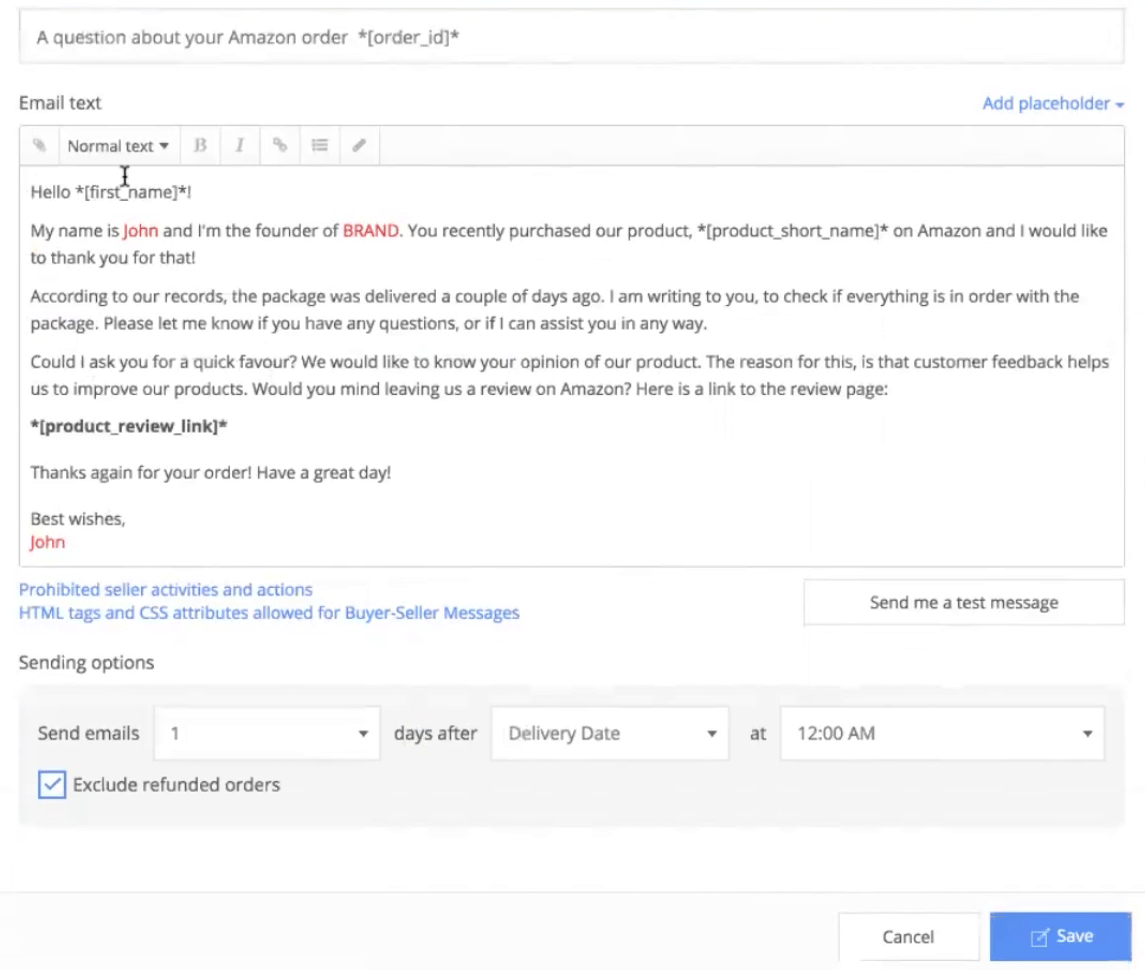
Using the feature, you can send your customers automated emails, asking them for feedback and for reviews. As long as you comply with buyer-seller messaging rules within Amazon TOS, you can configure campaigns here and apply this campaign to all products or just selected products.
Sellerboard has an automated message template for it that you can configure using some placeholder, like the first name or product short name, for example. And you can ask for a review.
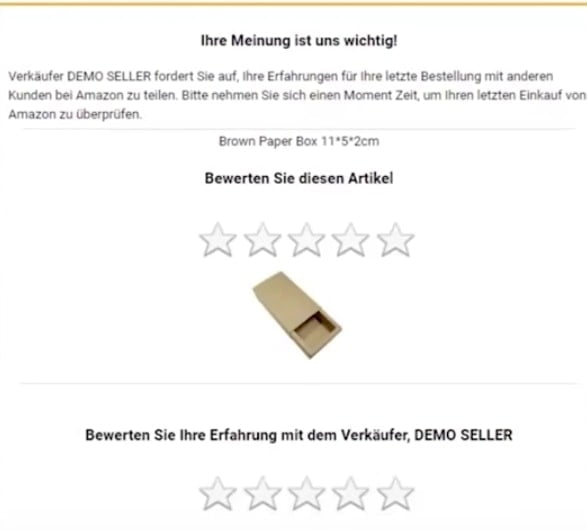
Right now you can use a standard Amazon “Request a Review” email template instead of a custom one. This way you protect yourself from being punished for disobeying Amazon’s communication guidelines. It’s your choice which of these two you’re gonna go with.
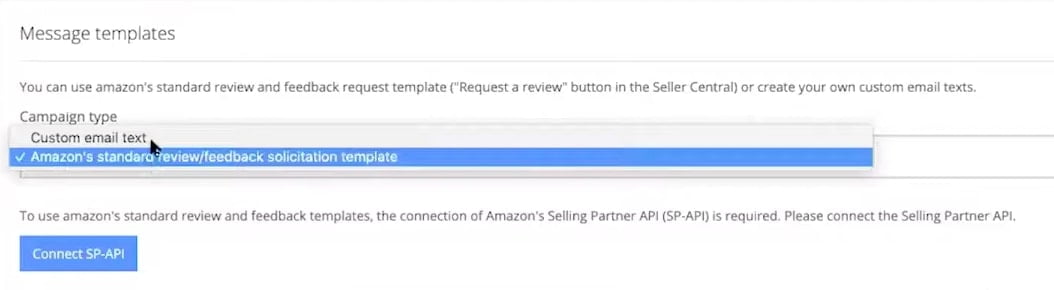
Here’s a template that basically asks for a product review. You can insert this placeholder, which will then be automatically converted to a product revealing:
And in case you choose to use the template, by selecting this option you’ll immediately see an example of how the email looks like. To use Amazon’s standard review and feedback templates, you are required to set up a Selling Partner’s API (SP API) which you can do within sellerboard.
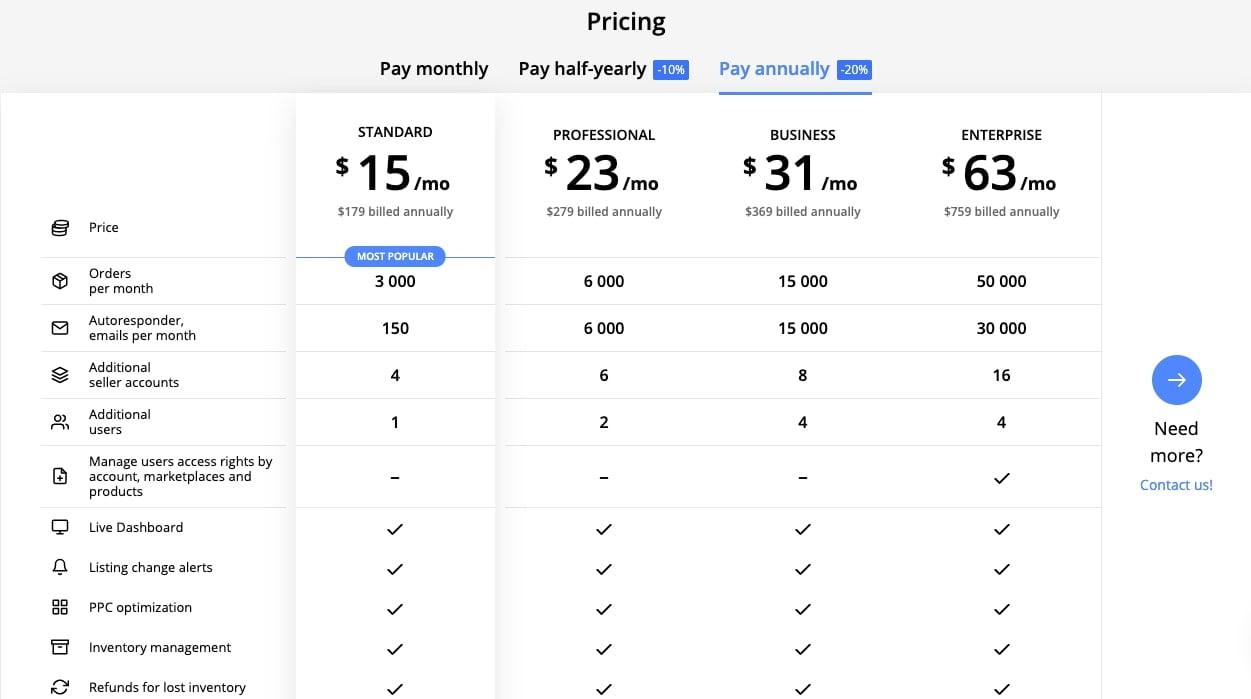
sellerboard pricing
Sellerboard pricing starts at $15 a month. So if you have less than 3,000 per month, you only need to pay $15 a month. If you have more than that, you need to pay a little bit more because it gets really hard for us to process all this amount of data.
There is a demo account on the website. You don’t need to register, you don’t need to enter your email, just go on the website and click “Demo” and then you can basically try the software yourself without registering.
On the website, there is a little chat box in the bottom right corner so you can click on it and just drop sellerboard a message. They try to respond as fast as possible, but sometimes you need to wait a little.
Use coupon code DEMOMONDAYS and get an extended 2-month free trial for sellerboard. Click this link to find out more.
First 2 months for FREE