
Instantly see your Amazon sales and profit on your personal dashboard. We will display your financial metrics like Sales, Profit, PPC Spend, Amazon fees, ROI, Refunds and other key numbers.
In Seller Metrix you can also view your sales per ASIN – so you can easily identify your best (and worst) performing products and take appropriate action.
 Extended 2 months trial
Seller Metrix is presented by Per-Ola Röst.
List of features covered in this video:
00:31 About Seller Metrix
01:44 Seller Metrix Dashboard
02:47 Mobile App for Seller Metrix
02:55 Explanation about different marketplaces
03:52 Date picker
04:23 Net profit, orders, units
04:51 How your products have performed over time
05:15 Daily setting
06:31 Negative trends
06:48 Notes
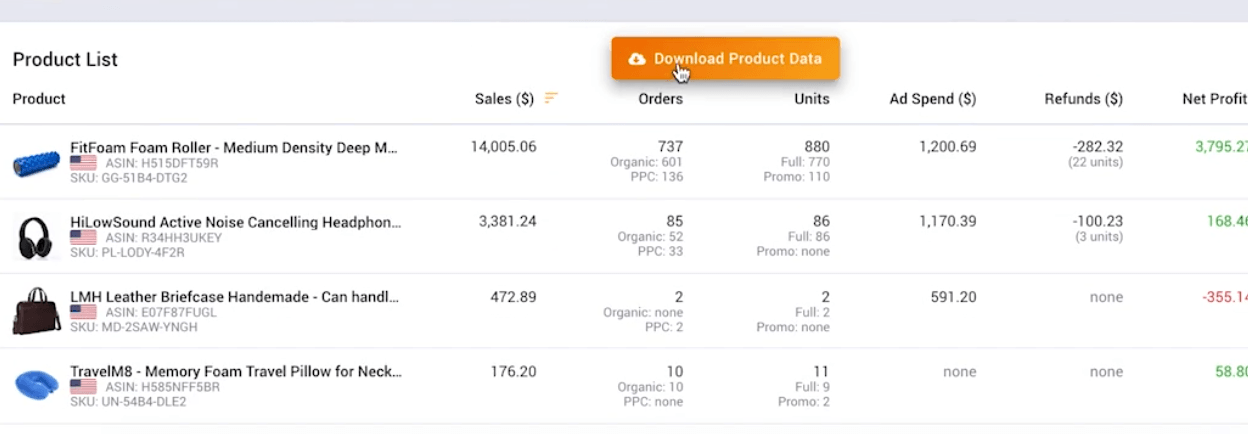
07:46 Product list
08:39 Understand what has gone wrong
10:27 Negative trends
11:10 Average review rating
12:36 Product section
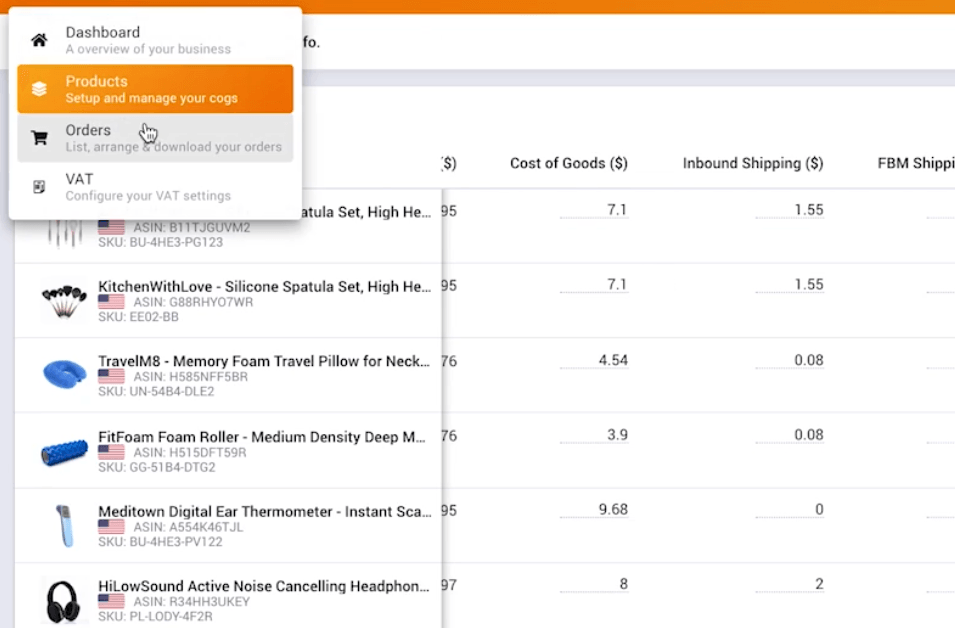
12:54 Cost of goods, Inbound shipping, FBM Shipping, FBM Fees
13:12 Profit and Margins
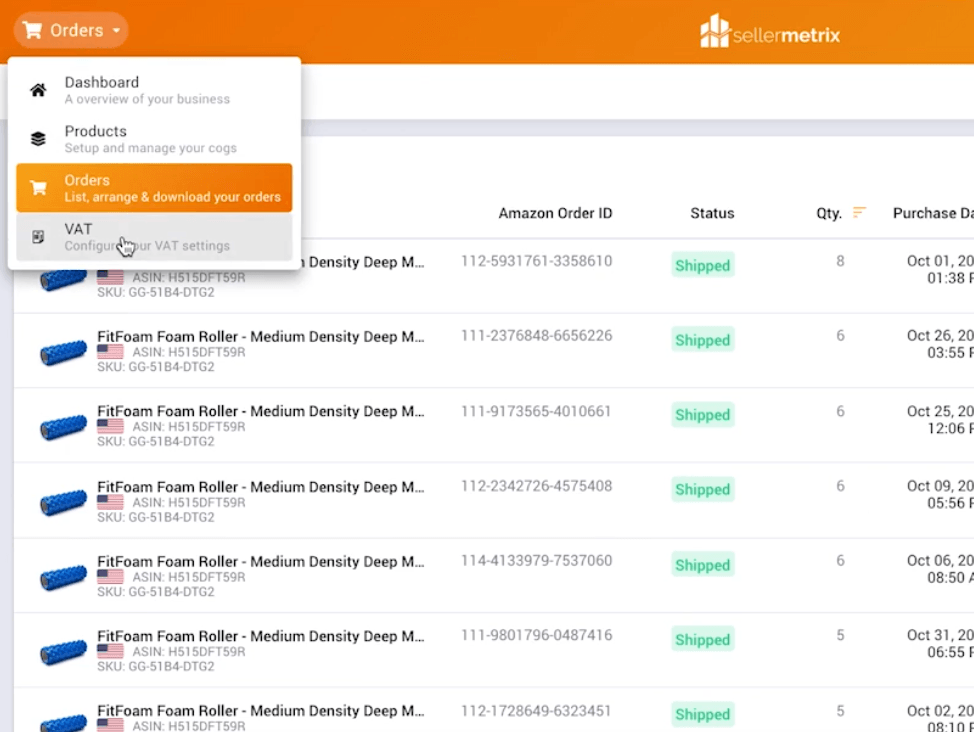
13:51 Order section
14:33 VAT selling in Europe
14:54 CSV file of downloading product data
15:13 Warp up for Seller Metrix
15:29 Features planned in the future
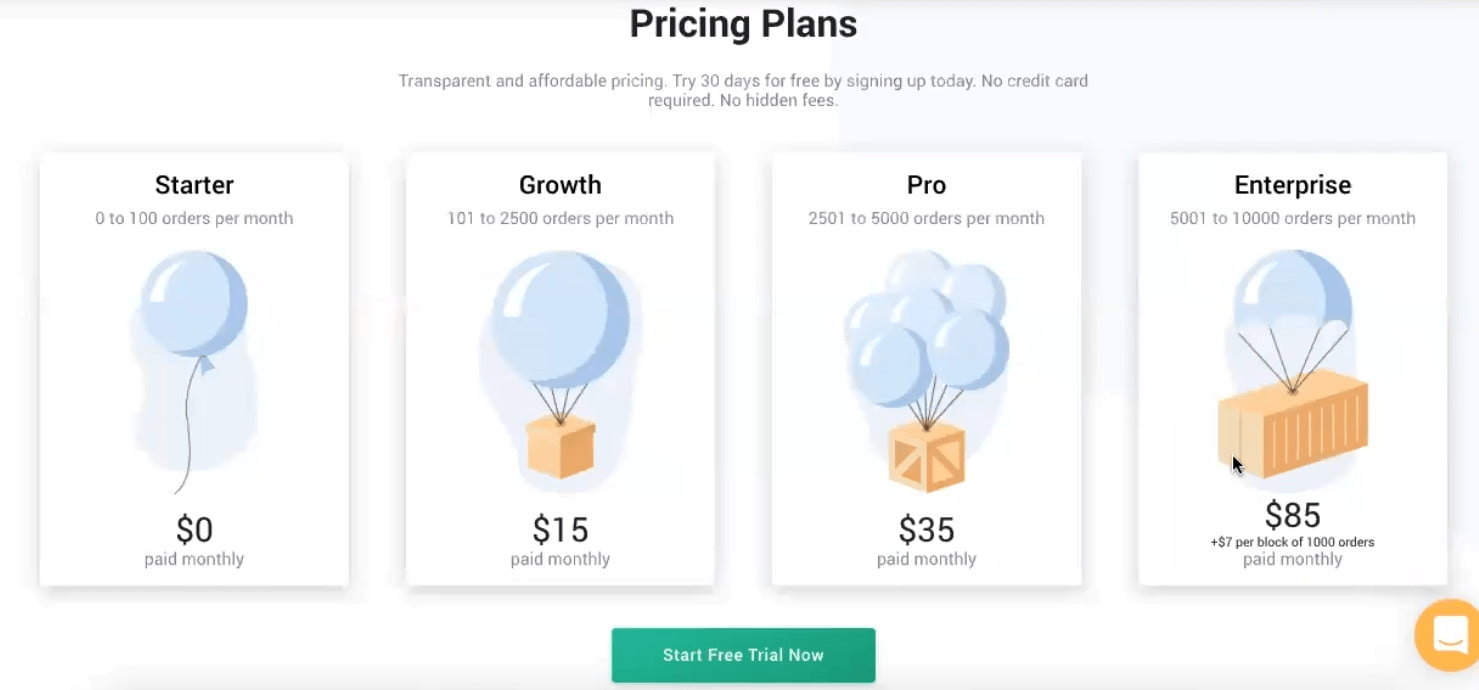
16:14 Pricing
17:30 Support for using Seller Metrix tool
17:58 Special offer – an extended free trial for two months
Transcript – Walk-through of Seller Metrix
0:00] Augustas: Welcome back to Demo Mondays. Demo Mondays is a video series where we talk to different software creators who are creating products for Amazon sellers and ask them to present their products just like this on the screen. And today my guest is Seller Metrix.
[00:22] Augustas: Seller Metrix is presented by Per-Ola Röst. Hello Per-Ola.
[00:27] Per-Ola: Hi Augustas. Thank you for having me on Demo Mondays.
[00:31] Augustas: Cool. So please, tell us what is Seller Metrix and how does it help Amazon sellers?
[00:37] Per-Ola: Seller Metrix is an analytical tool for Amazon sellers. We help our users understand, how well they are doing on Amazon by calculating their profit and other important metrics like ROI, profit margin or, if you’re struggling, Seller Metrix can help you understand, why or where you are leaking money. And another big thing with Seller Metrix is that we report sales data in real-time so that you will be able to see straight away when you sold a product.
[01:11] Augustas: That’s good. That’s nice. And your target users, I assume, any kind of Amazon sellers, right?
[01:18] Per-Ola: Yeah. You will need a professional seller central account to be able to sign up. Most sellers do, but then it doesn’t matter if you’re big or small or you do FBA or FBM, we catered to any Amazon seller, and anyone will be able to get the benefits from using Seller Metrix.
[01:35] Augustas: Cool. I think I have all questions answered and let’s check how Seller Metrix looks insight.
[01:44] Per-Ola: Now we are looking at the Seller Metrix dashboard. When you sign up, you connect your Amazon seller central account, which allows us to import your sales data to Seller Metrix. And after some time to import it, you will see something like this.

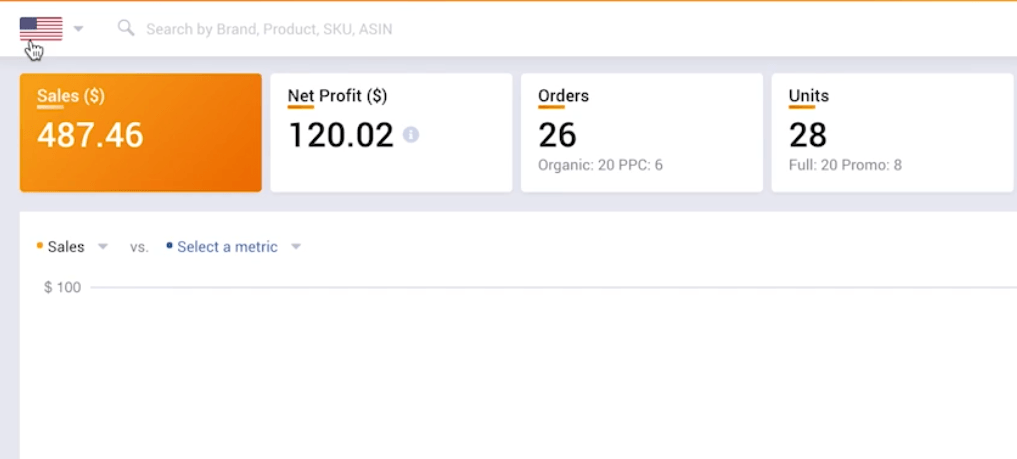
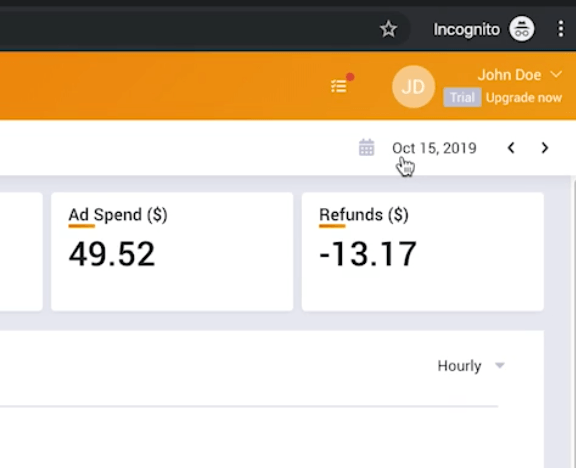
[01:58] Per-Ola: We will go through some of the main features together to give you an idea of how you can use the software. So one of the most popular ways to use Seller Metrix is checking your daily sales and profit. You can select today’s state with the date picker here in the top right corner. And as you probably know, the sales data in Amazon seller central is delayed by about one to two days, because Amazon only really counts a sale after the order is shipped, which can take one to two days. In Seller Metrix, we have developed an algorithm that estimates your sales and profit in real-time, so you can instantly see your orders, as they are coming in. In this case, we can see that 28 units have been sold with a $120 net profit and you can also scroll down to see exactly which products were sold here.
[02:47] Per-Ola: There is also a Seller Metrix mobile app for iOS and Android, so you can check your sales and profit wherever you are with your phone. In the top left corner, we see this US flag, which means that we’re looking at our sales data in the US, so if you’re selling in multiple marketplaces, like Germany and Spain, you can switch easily between them. There’s also a global dashboard where you can see your total global Amazon sales and profit. By default, the values in the global dashboard is shown in US dollars. But you can change this to see it in Euro for example. Or, I think we support most of the big currencies in the world and we can easily add more on-demand. But in this example, we will continue to look at the US. I should also mention, that we support all Amazon marketplaces. So the USA, Canada, Mexico, all European, Amazon marketplaces. So Germany, Spain, France, Italy, the UK, and also Japan, India, Australia, and Singapore.
Then moving over to the right side, we have the date picker and we can see that October 15th is selected. This means that the data in the dashboard will be limited to this day, but you can, of course, change it to any date range you want. For example, like this, August 2019. These cards here are the summary for your selection. So in this case, your US sales in August, 2019 is $24,000 in sales.
Here’s your net profit and you can click the eye to see exactly how the net profit is calculated: how much discounts are given out, the refunds, ad spend, Amazon fees, taxes, and so on. Under orders, you have how many orders were sold organically and how many were generated through Amazon advertising or PPC. On the units you can see how many were full-priced units and how many were sold at a discount or at a promotion.

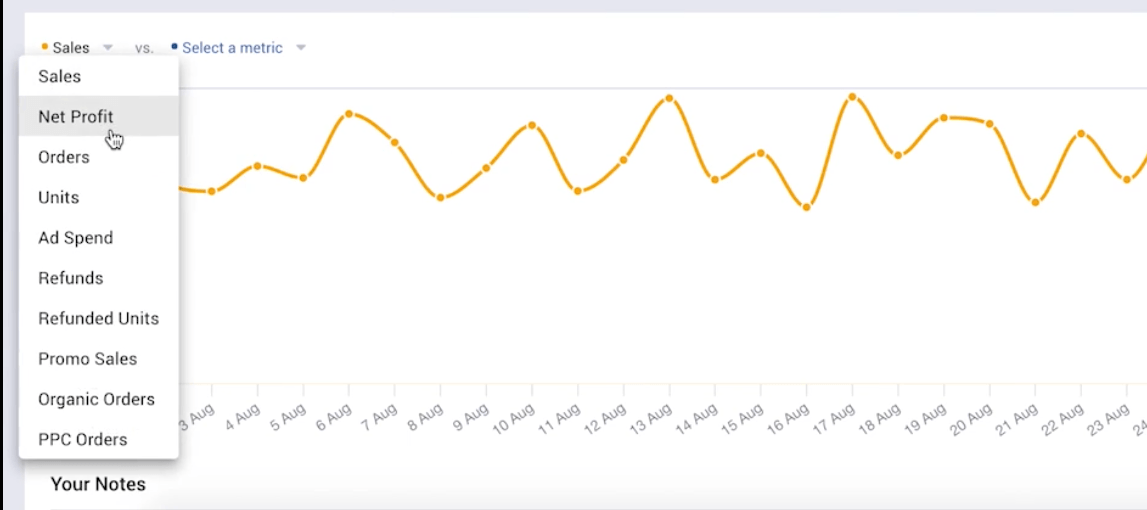
[04:51] Per-Ola: In the graph, you can see how your products have performed over time. Now we’re looking at sales here in orange, but you can change to display any parameter, for example, net profit orders, units, ad spend, and so on, and see how it changed over time. You can also select a secondary metric to display in the graph. We will look at that a little bit later.
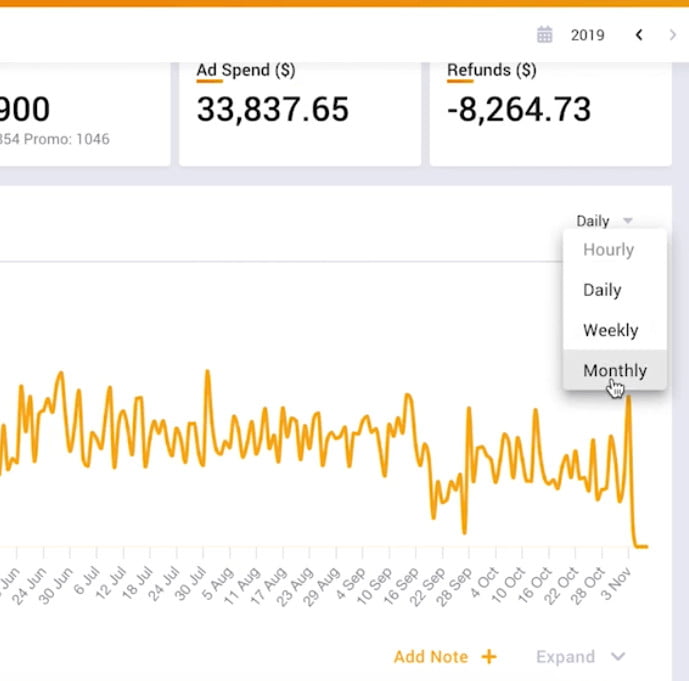
On the right side, you see daily. This means that each data point in the graph is one day. If we’re looking at a very large date range, it can be very difficult to spot trends using the daily setting. So if I select this year, you can see that that sales fluctuate up and down quite a lot. So if I change from daily to monthly, you will see that we get a much smoother graph that is much easier to interpret and determine, which months were good and which months were not. This last data point is very partial, just a few days. So what I will do is, I will select January 1st to October 31st. So this will get rid of that last data point.
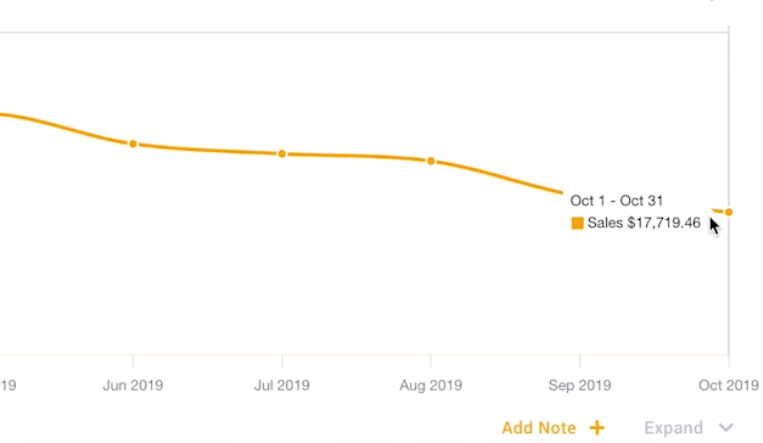
[06:07] Per-Ola: Let’s look at this graph and see if we can say anything about it. So earlier this year we saw $26, 000, $29,000, $20,000, $30,000. And since May, we’ve seen this slow downward trajectory. So down to $26, 000, $24,000, $19,000 and even $17,700 in October, 2019.
Below the graph, you have your notes. Here you can write down certain events or mark the changes you make to your products. For example, changing the product images, the price and so on. We can expand it and we can see, that for this product on September 3rd, we lower the price, we went out of stock for the foam roller and then back in stock again here. And you can tag your notes to specific products, brands or marketplaces. If you want to tag a specific holiday in Germany, for example, you can do that.
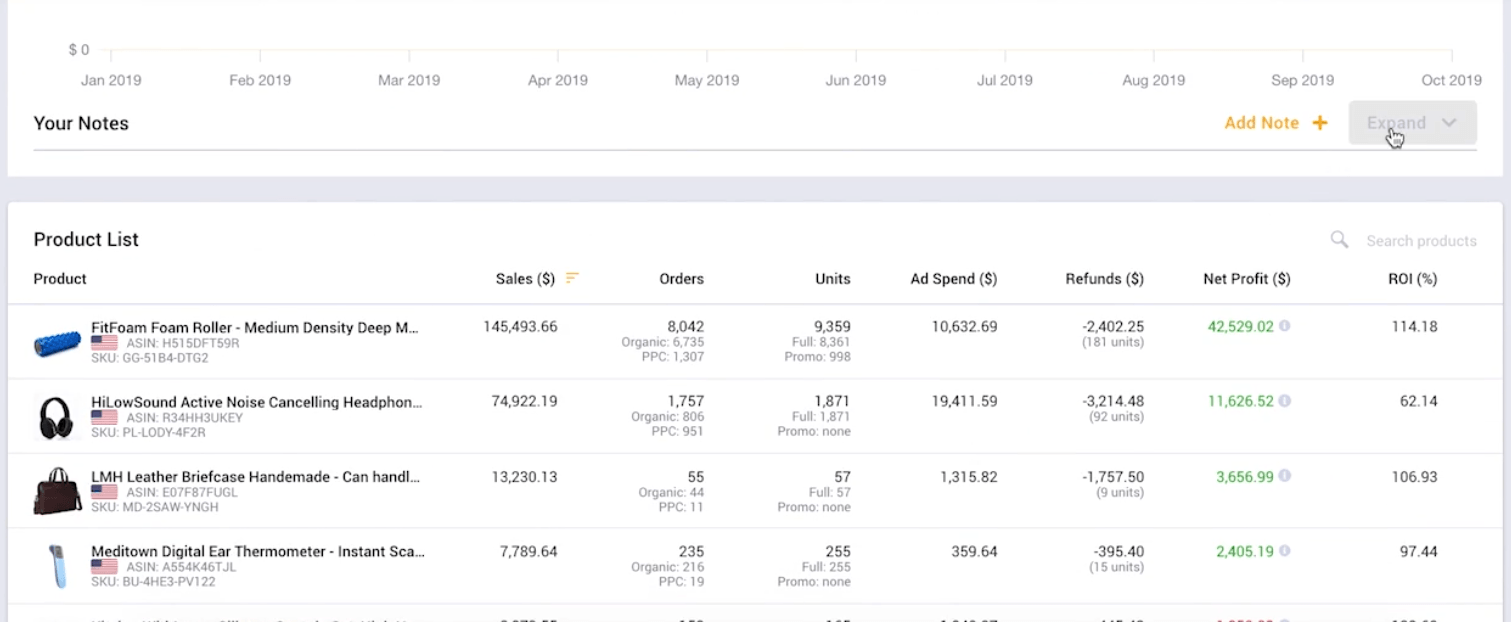
[07:24] Per-Ola: One more thing I want to say about the notes is, that they can actually be really good to explain why you see certain trends. A trend can be an effect of an action that the seller took or some other event that happened and the notes can help you keep track of that and follow up on it. The next thing is the product list.
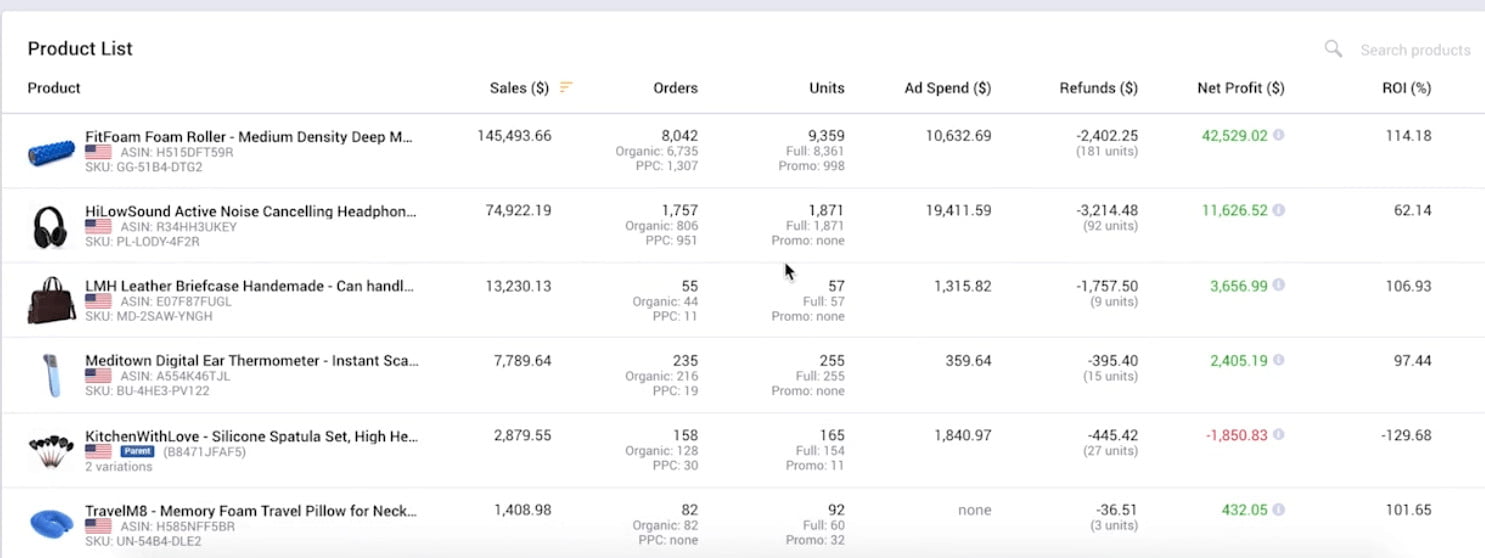
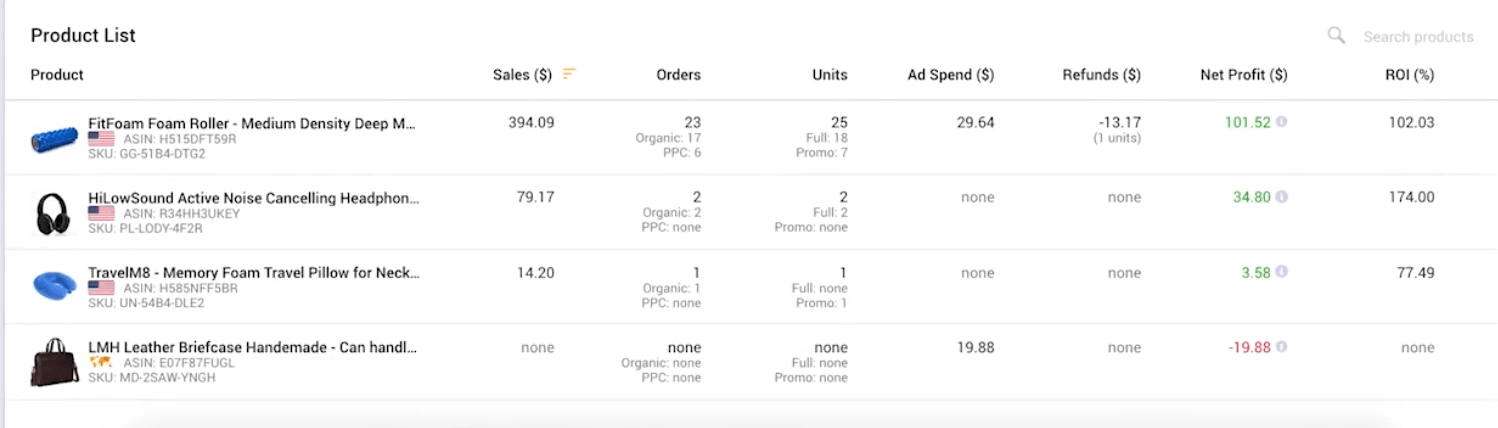
Here you can see how each product is performing individually. So you can see the sales, orders, ad spend, refunds, net profit for each order individually, use your inventory if it’s FBA or FBM. And you can also press the eye here like we did in the summary, to see a detailed breakdown for each product individually.
[08:07] Per-Ola: What we see for this account is, that it’s dominated by these two products here, the foam roller and the headphones. Scrolling back up to the top, we see the $245,000 in sales. We’re made up by these two products at about $220,000, so these two products dominate. If we go back to this negative trend that we saw earlier, it’s very likely that one or both of these two products are involved. So what we’re going to do now is, look closer at them to see if we can better understand what has gone wrong, so we can take action to resolve that.
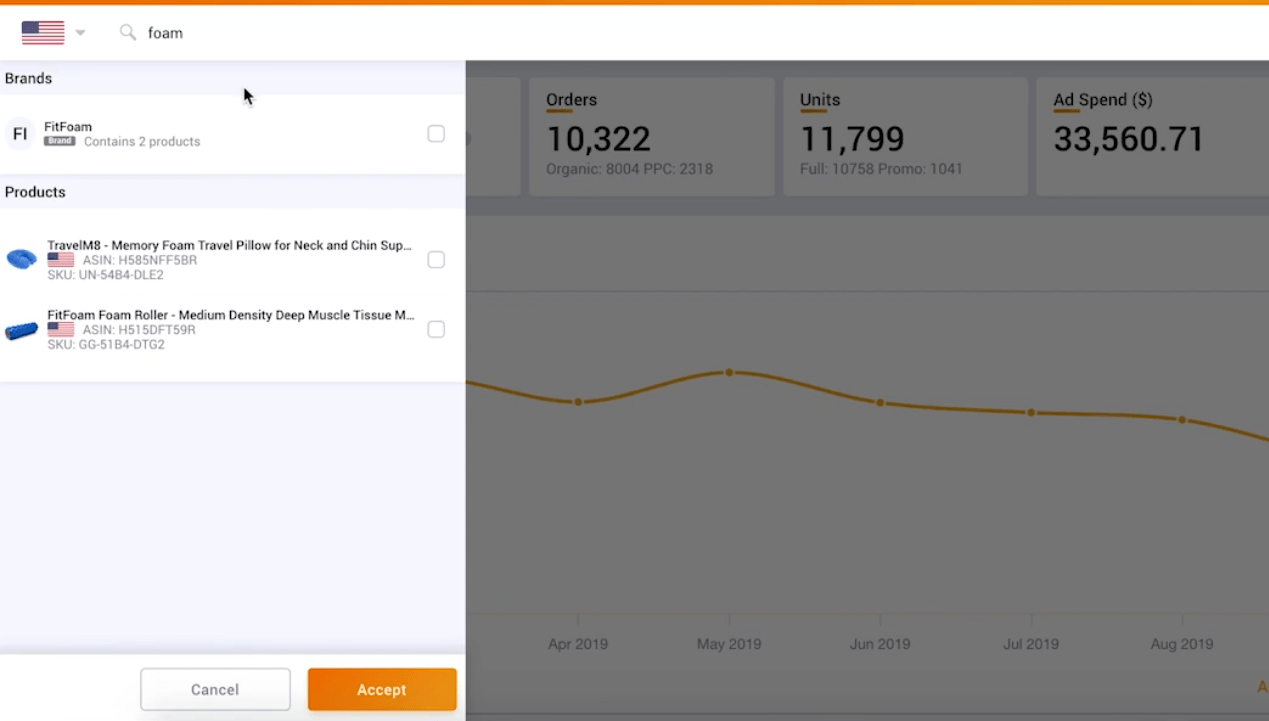
So in Heather, we can search and select a specific product. Let’s start by selecting the foam roller. So I can search for foam here and we get some results. We get their brand fit foam and also a travel pillow and a foam roller. And we can make multiple selections like this, if you want to analyze multiple products, or if you want to analyze all of your organic products or all of your products belonging to a certain employee, and so on. But in this case we want to select only the foam roller, so we select it and click accept. And what we see in the graph is, that it performed pretty consistently throughout the year, with a dip here in September. Down to $11,000 from $15,000, $16,000 in sales.
[09:36] Per-Ola: Looking at the notes, we can see, if we can understand why, and we can see that we went out of stock here on September 20th, so at 3rd of the month we had no sales most likely, and then back in stock on October 1st. So that would explain why we see this dip. And we have rebounded pretty nicely here in October, back to $13,700 in sales. Not quite the levels we saw before, but still quite good. Going back to the trend again that we saw earlier, I wouldn’t say that this product has anything to do with it other than this dip. I don’t see a downward negative trend. So we’re going to look at the headphones now and we cleared the previous selections and we make a new selection by searching for headphones. We select them and click accept.

[11:10] Per-Ola: And we can see here that we dropped in April to 4 stars average review rating, and we played around with a price in July and in August we bumped back up to 4.5-star average review rating again. But in April is where we started to see these negative trends. So it could have something to do with us dropping average review rating, starting to lose conversion rates, starting to lose ranking. And slowly but surely, we ranking now on pages 2, 3, 4 and we’re not seeing the sales that we used to. We bumped back up to 4.5-star average, but it’s possible that we haven’t regained our previous ranking. So what we could do is, look at running a promotion. I can see here that we haven’t run any promotion this year for this product. Not a single unit has been sold at a promotion. So that could be one thing we could do. We could also look at increasing the ad spend temporarily or use a launch service or something like this.
[12:10] Per-Ola: Now we saw how you can use Seller Metrix to get an overview of your sales and profit on Amazon, and also how you can look for trends and spot underperforming products. If you have a bigger account with more products, this could take a longer time, but the principles are the same and it’s incredibly useful. Now let me show you some other features in Seller Metrix.
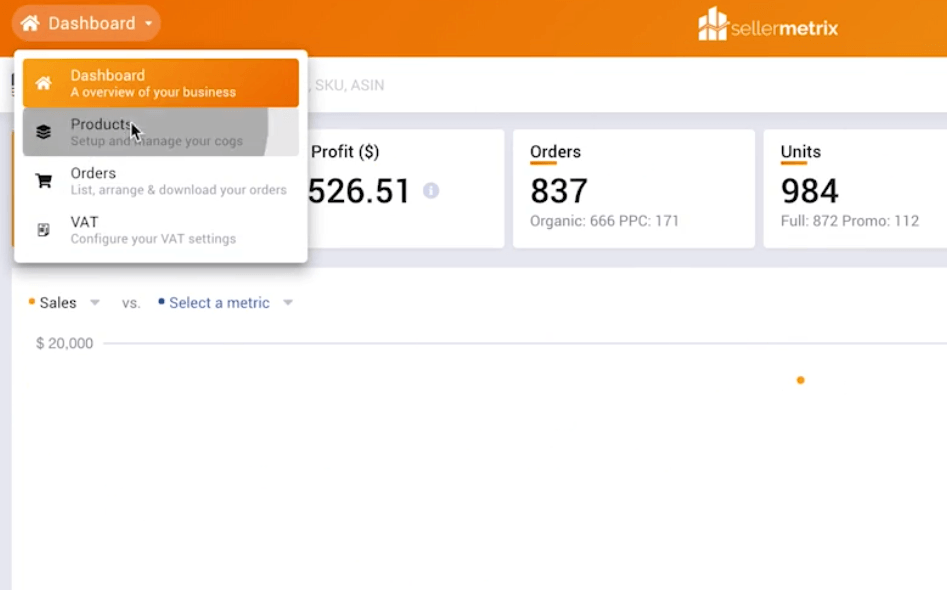
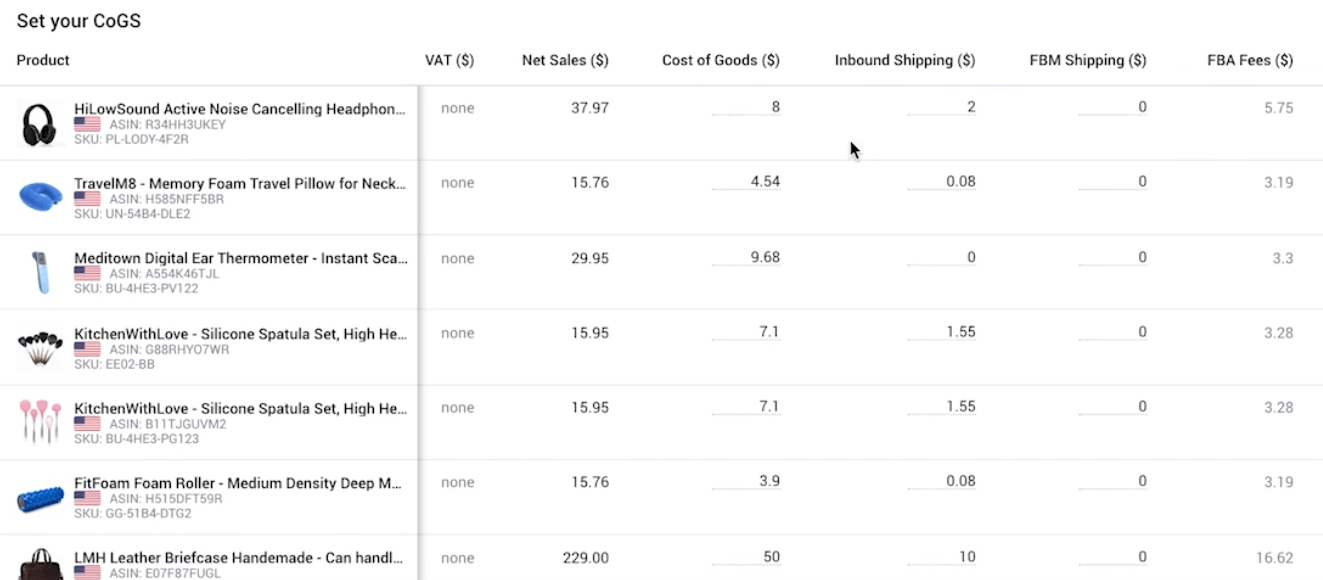
So far, we only been looking at the dashboard, but you can change to the Product section here, where all of your products are listed. This is where you can set up the costs of your product. You can set it manually like this or you can bulk upload it with a CSV file here. Cost of goods is what you buy the product for. Inbound shipping is the cost of shipping from your factory to the Amazon warehouse or to your own warehouse if you do FBM. FBM shipping is the shipping from your own warehouse, if you do FBM directly to the customer, this is there, the shipping cost for that.
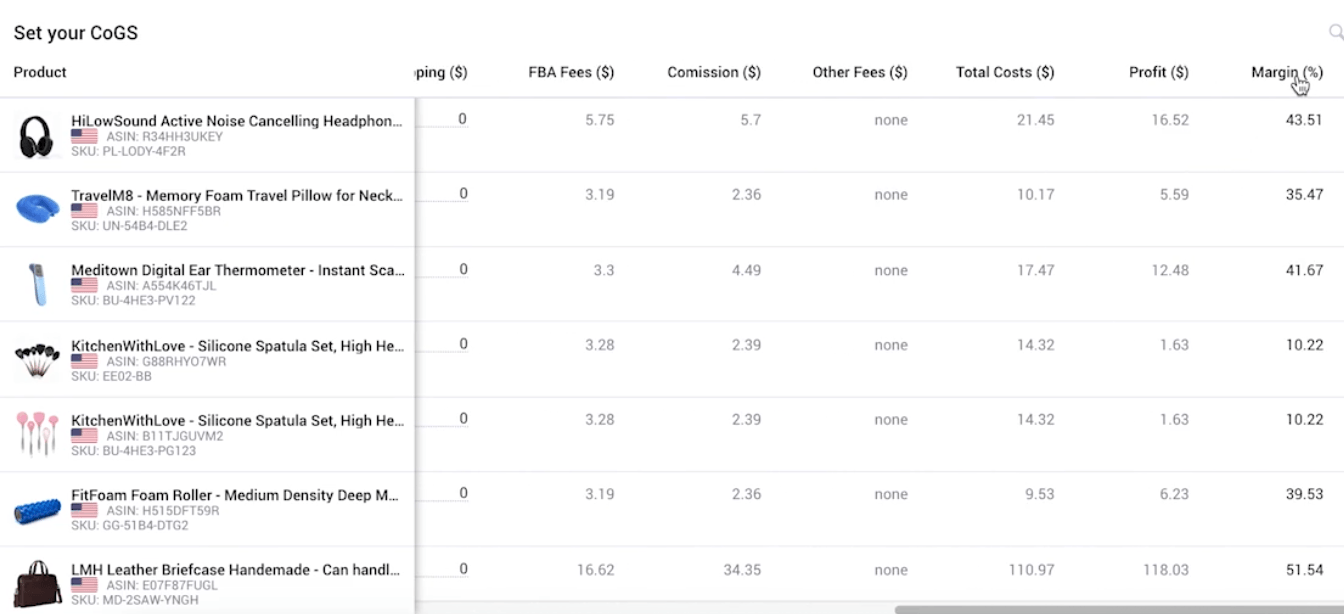
Scrolling to the right, we can see their profit for each product, and the margin. And we can click on a column to arrange it. We can do that to isolate, for example, products with a particularly low-profit margin like this. That could be a cue for us to raise the price or renegotiate the purchase price from the producer or the supplier.
[13:38] Per-Ola: After getting access to Seller Metrix cracked account, setting up your product cost is probably one of the first things you will want to do, as it’s the only way to get an accurate profit calculation in the dashboard that we saw earlier. Then we can switch over to the order section.
Here you can see each order: the state does – if it’s shipped, pending, canceled, refunded, and so on, and also, the amount. The detailed breakdown for each product individually. You can also download these orders as a CSV file. Quantity here is the number of units sold for each order. You can press this column to arrange it like this. You can see, if your customers are buying multiple products per order, or if they just buy one unit per order. If you’re selling in Europe, you can switch here to the VAT section to set up your VAT.
[14:41] Per-Ola: The VAT can have a pretty big impact on your bottom line, so it’s important to set this up if you’re selling in Europe. There’s one last thing I want to show you, which is if we go back to the dashboard and scroll down to the product list, you can right-click to download product data. This will generate a CSV file for you with all of the data that you see here: the orders, organic PPC, ad spend, refunds, and so on. This gives you the flexibility to prepare your own custom reports as you wish or sync with other software. So that wraps up the demo for Seller Metrix. Thank you so much for listening.
[15:18] Augustas: Thank you very much. I like your design. It’s very clean and tidy. Everything is very clear. I like when the everything, numbers, a bake, written, and so on. Can you tell us a little bit, what the features in the future you are planning to release for your existing customers?
[15:37] Per-Ola: We are working on a few different things. Right now we are making a refund section, where you can easily find it orders, where Amazon owns your money, so you can reach out to Amazon and claim it back. We’re almost done with a solution that can show you, how many clicks you are getting to your Amazon product listings. So from that, you can see your conversion rate. If you are having a product that is not doing so well, you can see, if the problems are because customers are not coming to your product listing, or if they are coming, but not converting.
[16:11] Augustas: Okay. Can you tell us the pricing? How does it adjust, according to the orders or according to marketplaces?
[16:22] Per-Ola: We charge based on orders each month. So for very small sellers, we have our forever free plan. So, up to a 100 orders a month, you pay nothing for Seller Metrix. Or if you are a seller, that is having a really bad month, where are you stocking out, 4 orders below or 4 months below a hundred orders, it’s free, completely free. Between 100 and 500 orders, it’s $15 a month, and then it scales up to $35 a month up to 5,000 orders. Then you’re selling above 150 units a day or 150 orders a day. And enterprise users up to 10,000 orders, they pay $85 a month. There’s no extra fee for connecting additional. Seller central account you can connect as many as you want from all over the world.
[17:16] Augustas: That’s a good deal. Usually, as other companies try to, they ask for extra money, when you connect to a different marketplace. That’s a good feature you have. Can you tell us a little bit about support? How does it work? I saw on your website there is a bubble, chat bubble, right? So, is it instant support, or people have to wait a few hours?
[17:39] Per-Ola: We tried to make it instant, but sometimes we have to sleep and eat, but usually within an hour you will have a response, so you can open that chat to write to us or you can also send us an email to support at sellermetrix.com, and we’ll get back to you as soon as we can.
[17:58] Augustas: Great. And the final question, do you have any offer for Demo Mondays viewers?
[18:04] Per-Ola: We do – it’s an extended free trial. So anyone trying Seller Metrix gets one month for free. But with DEMO MONDAYS, you will be able to get two months of a free trial. So we will add a link to the video. You can also write to us using the chat, just write DEMO MONDAYS, and we’ll manually extend it for you.
[18:28] Augustas: Cool. So people who want to extend a trial for Seller Metrix, just follow the links below this video and thank you very much Per-Ola for this introduction to your tool. I think it’s quite new, but it looks promising. I really give compliments for the design and thank you very much, and good luck with your business. Bye, bye.
[18:50] Per-Ola: Thank you so much, Augustas. See you. Bye, bye.