
Amazon Product Research is revolutionized with Jungle Scout. FBA Sellers can now find profitable product ideas, get sales data & estimates, and more. Use our Web App to filter Amazon’s entire database by category, price, sales, and more to find untapped gems you can capitalize on. Plus, track any competitior’s activity over time. Be confident sales are there before you invest. We also have a chrome extension that allows you instant product insights on any page as you browse. With a click, you’ll see each product’s price, estimated sales, review count and more for an accurate comparison on the fly.
 10% off 1 month! 25% off 3 months! 30% off 1 year!
Jungle Scout is presented by Lennard Smith.
List of features covered in this video:
00:41 What JungleScout is and what problem does it solve for Amazon sellers
01:41 What type of Amazon sellers Jungle Scout fits the best?
02:42 Which Amazon marketplaces are covered by Jungle Scout?
03:23 Dashboard of the web app: Product Tracker, Product Database, Niche Hunter
04:20 Product Database usage overview. Explanation of the most important filters.
08:42 Listing Quality Score explanation
10:12 Overview of the filters: Product Tier, Seller (Amazon, FBA, FBM), Estimated revenue, Weight, Number of seller, Net amount
13:03 Overview of the Database Search Results table columns
18:17 Product Tracker usage overview
19:49 Analysing the Daily Estimates Data graph
21:54 Adding product to the Product Tracker and analysing the data pulled by JungleScout app
23:22 Creating multiple tabs for different product groups in order to keep product research organized
23:53 How Jungle Scout calculates sales estimate?
27:12 Niche Hunter – a different way to get ideas for new products
31:23 Using the Niche Hunter data to verify if discovered keyword can be worth to look at
33:27 JungleScout Chrome Extension screen overview
35:08 Filtering product list results using the filters
35:47 Do you need Jungle Scout web app or chrome extension or both?
36:21 Additional tools of the chrome extension: Google Trends, Screenshot share button, Product Word Cloud
39:50 What is the difference between the Chrome Extension Lite and Pro?
40:49 Pricing overview
42:37 Upcoming Features: re-design of Jungle Scout, making things faster and better, keyword research tools, mobile apps.
44:53 Support – how sellers can get in touch with Jungle Scout support?
Transcript – Walk-through of Jungle Scout
[00:00] Augustas: Welcome back to another session of Demo Mondays. Demo Mondays is video series published on Mondays where I invite different Amazon seller software developers, creators, and representatives and I ask them to show their products just like this on the screen. And today my guest is Jungle Scout.
[00:25] Augustas: And Jungle Scout is presented by Lenny Smith. Hello Lenny.
[00:30] Lenny: Hey Augustas, thanks for having me man. It’s exciting, I’m keen to start talking about Jungle Scout.
[00:47] Augustas: For me too, it’s a classic software. Might be some people watching who haven’t seen or don’t know what Jungle Scout is. So can you shortly explain what is it and what problem does it solve for Amazon sellers?
[00:53] Lenny: Yeah, absolutely. Well, I guess in a nut case Jungle Scout is here to make Amazon product research easier for the sellers. Because the thing that you think might sell well might not always be the thing that you should find that. We believe that you should look at data before you make these big decisions in terms of what products you sell, cause’ really success of an Amazon business comes down to the products that you choose to sell. That’s really kind of the foundation. So you want to make sure that you’ve got the best sort of data to look at in order to make those decisions. So, essentially Jungle Scout makes it easier for people selling on Amazon to find profitable products to sell.
[01:42] Augustas: And what kind of seller is the best fit for your software?
[01:48] Lenny: Well, that’s interesting because when we first started out, we were targeting people that were looking to sell their very first product on Amazon, but now we’ve kind of expanded and we’re helping people and businesses of all sizes from the beginning or looking to sell their first product to people that are selling a few products and they want to add a new product to their line up. And then we’ve also got some larger businesses that have got already dozens or hundreds of products and they’re looking to expand into new markets as well. One thing I should mention is that we do have a multiple, like nine different marketplaces. We used to be just in the US and now we’ve expanded. So another type of person that we target are people that might have a successful US business or in one particular market and they’re looking to expand internationally as well. So really the short answer is that we are kind of helping Amazon sellers of all stages.
[02:43] Augustas: Alright. So let’s talk about marketplaces. Which online marketplaces are covered?
[02:48] Lenny: That is a good question. I’ll just read them out here. So we’ve got the US, Canada, Germany, Spain, France, India, Italy, Mexico and the UK.
[03:01] Augustas: All right. So even India is there already.
[03:04] Lenny: Yes.
[03:07] Augustas: Is it necessary to link seller account with the Jungle Scout?
[03:11] Lenny: No, you don’t need to do that.
[03:14] Augustas: OK. So let’s, jump into the screen-sharing and let’s see how Jungle Scout works.
[03:23] Lenny: Absolutely. So, this is the screen that you see when you first log into. This is our Jungle Scout web App. We do have two products, one is a Chrome Extension and the other is a web app, so it’s sort of browser-based. OK. So when you log into the web app tool, you’ll see that we’ve got three apps up the top here. We’ve got the Product Tracker, Product Database, and the Niche Hunter. So those are the three tools that make up the web app. And so the way I like to look at it is that there’s sort of two stages of product research. You’ve got the first stage which is finding and generating as many product ideas as possible. And then the second stage is about trying to verify those sales in kind of short list of the products that you want to sell and verify how many sales those products are getting.
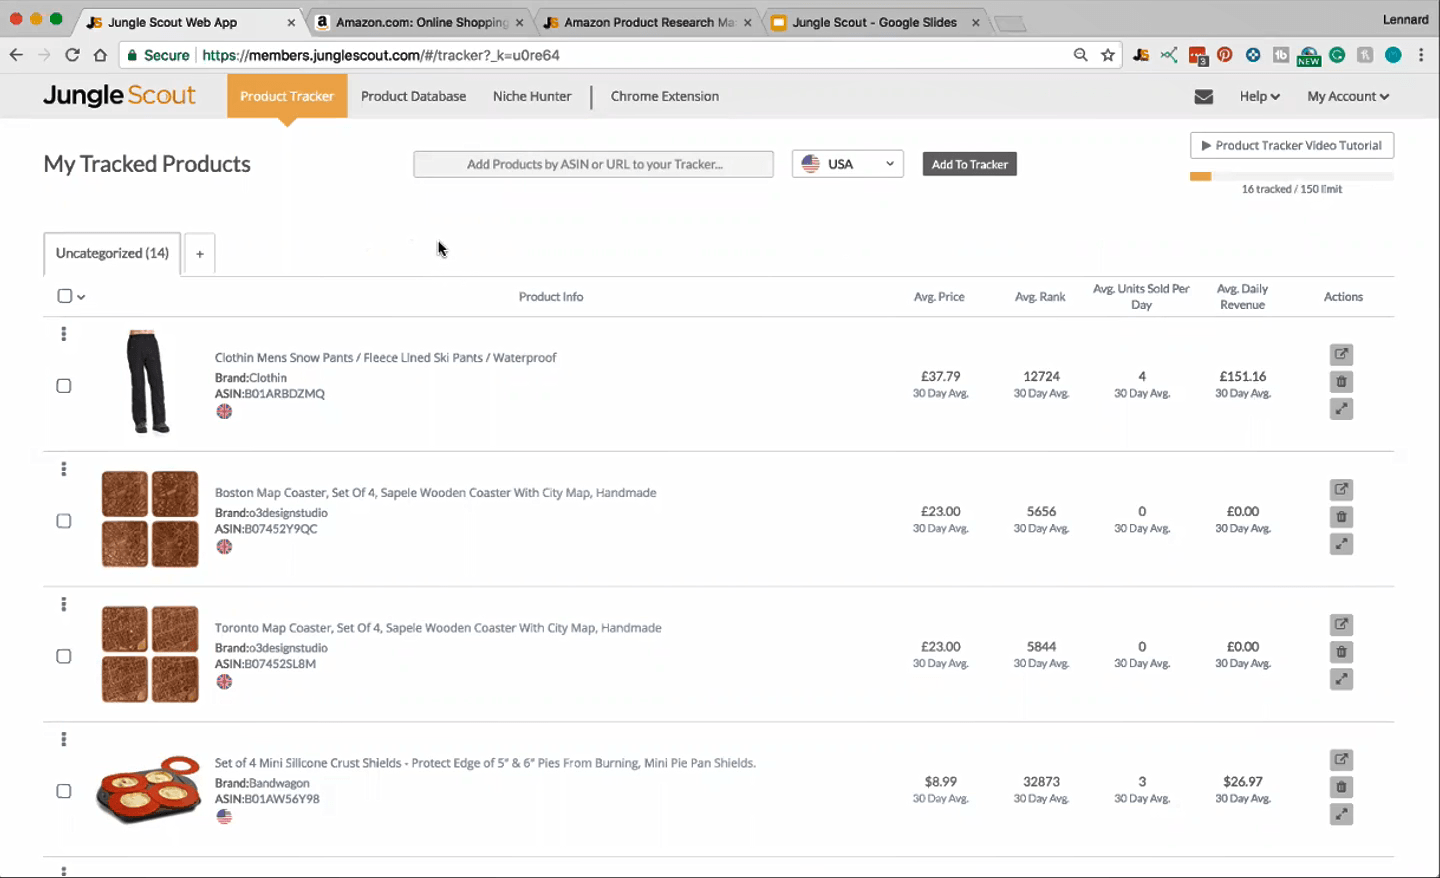
[04:09] Lenny: So for the first stage of finding and generating product ideas, the Product Database and the Niche Hunter, they help you find ideas and then the Product Tracker helps you verify them. So, if you were using the web app, the first thing you would do is come to either the Product Database or the Niche Hunter, and this is where we can drill down on just some product ideas so you’ll see that you can select the marketplace that you want. You can now select categories. I’ve just sort of pre selected some categories here and then you can come over and select some minimum and maximum values for all these different filters. So I’ll just name without going into too much detail a few of the main ones. So price is a very popular filter to use. We recommend anywhere between sort of like $15 to $60 or $70 or $80 in this case, most.
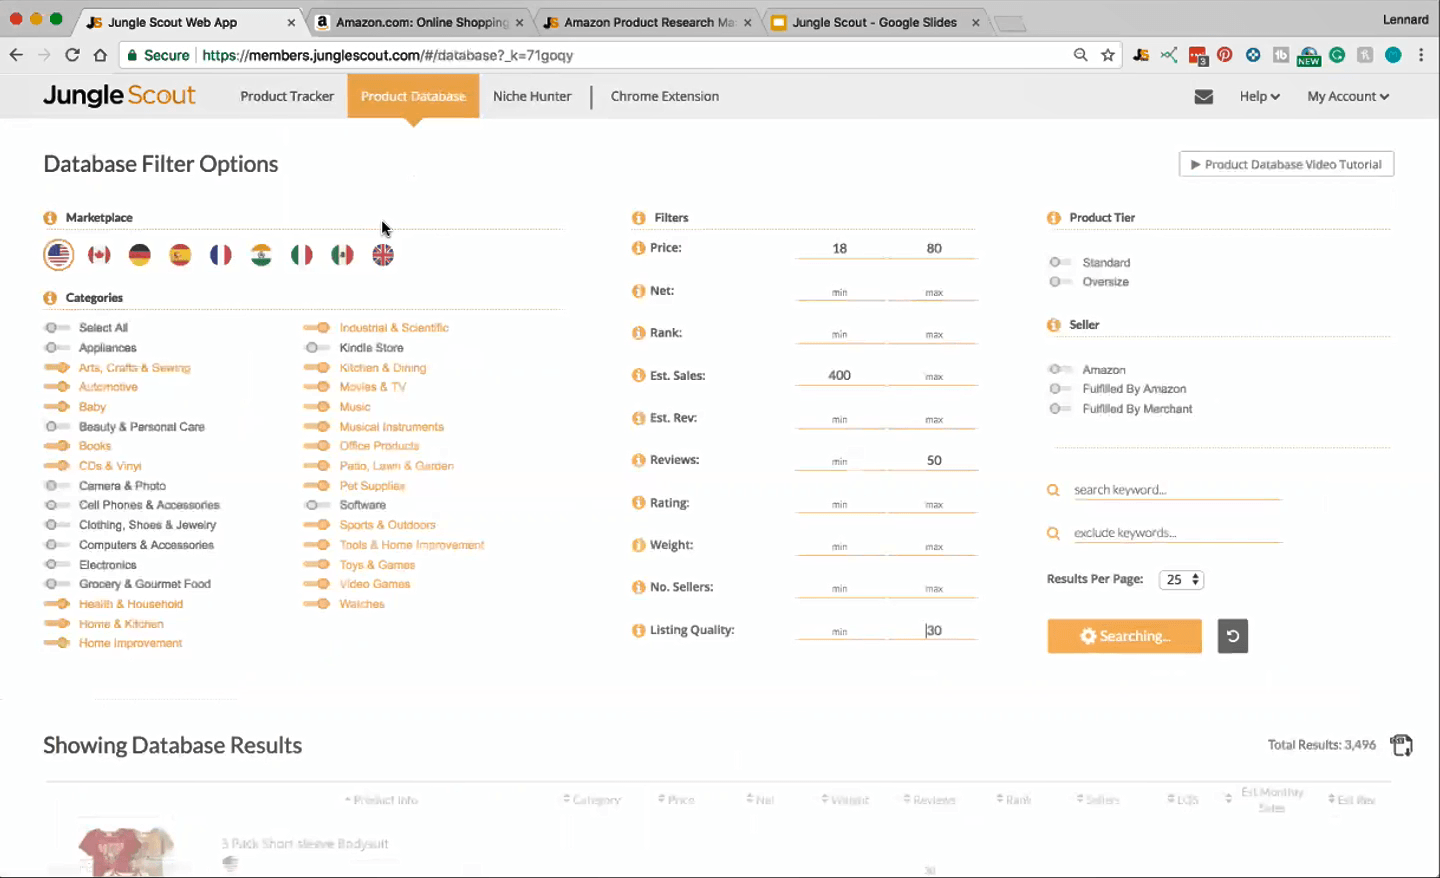
[05:08] Lenny: So if you go below $15, the profit margins get very slim. Generally it’s better to look for products of at least $15, $18, $20. Then the two of the main things. The other main things that you want to look at is demand and competition, so you essentially want to find products that have a high amount of demand. You want to know that people are looking for that particular product, so we want high demands, but at the same time we also want low competition. We want to make sure that if we sell that product, that it’s not going to be too competitive of a market to get into. So when it comes to demand, you can sort of gauge that by the number of monthly sales that product is getting. So we recommend looking for at least 300 or 400 sales per month, just as a general guide.
[05:56] Lenny: And then with reviews, that’s a good way to calculate the competition. So with this I would say you’d want under 50 or even under a 100 reviews on that particular listing. It is a reasonable guide to low competition. So again, that’s high demand, but low competition at the same time. Then if you want to look at some other filters, we’ve got a feature here, such as average star rating. So, let’s say if we’re over on Amazon and we type in Yoga Mat, let’s say, wait for that to come up. You say that each product on Amazon has a star rating here. So this one, he is four out of five stars. Now, the way that you would use the average star rating is generally you would set the maximum to, let’s say three stars, so you’re only looking at listings that are three or less. OK, so, they’re not greatly rated on Amazon, but if you pay that with, three or 400 sales per month, that means you’re looking at products that sell really well on Amazon.
[07:07] Lenny: You know, that there’s demand there, despite the fact that that listing or product isn’t rated overly that well, that means that people must really want that particular product. So if you could find products that people really want despite the fact that it’s not rated that well, then it essentially gives you the opportunity to come in and sell that same kind of products, but just improve upon it. If you can find ways to improve upon that product and fix the problems that other people are having, you can therefore capture a lot of both sales and that sort of market share. OK. So, age filter that we’ve got gives you the ability to do some slightly different searches so that you can kind of keep your product research fresh and, and try different strategies for finding good products to sell, and so I suppose the one thing that would be good to mention is that we spend a lot of time and resources in sort of building our tools such as the web app here, and also our chrome extension, but we equally spend a lot of time creating free education as well so that when you use our tools, you know, what sort of things to do and so forth.
[08:37] Lenny: Alright. So, I suppose before I move forward, is there any questions or anything I should elaborate on Augustas?
[08:37] Augustas: Yes, can you explain a little bit listing quality? How do you calculate and judge?
[08:50] Lenny: I can’t tell you the exact algorithm, but essentially what it’s made up of is, is a number of things. So you’ve got the listing quality score is a score that we give to all the products within our database, based on things like the number of images, their title, how many bullet points I’ve used, how well they filled out their description of all those things combined, create a listing quality score with 100 being a really good listing and one being a poor listing. I’ll just bring that up there. And then essentially what you’d be looking for is kind of a low listing quality score. So if you can find, again, products that are selling really well, but they’ve got a pool listing quality of say, 30 or 40, it’s not rated that well. You can then look at that listing and usually it becomes quite apparent they might have used that bullet points. So they might have only put in one or they might have one or two images and you can look at those images and they might be kind of blurry or very low quality. If people are still buying that product, then that sort of gives you a marketing opportunity to potentially just sell that same product but just improve a lot more the listing quality and so forth. So does that answer your question?
[08:50] Augustas: Yes, thank you.
[10:14] Lenny: Perfect. I guess I wasn’t sure how in depth to go because often we could talk for ages about all the different filters, but I guess the quickly breeze through these other ones, here we’ve got product tier. So, standard or oversize. Generally speaking, you want to stick to standard size products. Oversize ones are larger, heavier. There’s some restrictions in terms of how many you can send in the Amazon. They cost more in shipping. Particularly, if you’re just starting out, you want to be looking for ideally small lightweight products, which is usually going to be standard size. Then you can also filter products that have been so just by Amazon or people that are doing fulfilled by Amazon or fulfilled by merchant, which is where you fulfill it yourself. Generally speaking, my preference is to not check any of these and just search old products, but you can filter out those ones specifically.
[11:11] Lenny: Estimated revenue here is instead of looking at the number of sales, you can look at a specific revenue amount. Personally, I prefer to look at the actual sales numbers. Reviews we’ve talked about – every star rating the weight you can sort of filter by a weight, if you only want it to be out to a particular a weight. The number of sellers. That’s how many sellers are on a particular listing. So sometimes what you can try is, if you’re looking specifically for products that are sold by other private labelers, smaller businesses generally, then you could set the maximum number of sellers to one. So you’re only going to be looking at listings that have one seller on them and generally they’re going to be the smaller private label sellers versus some of the bigger brands that might have multiple sellers on it.
[12:05] Lenny: So that’s one way to use the number of sellers. We’ve got a listing quality score, which I just mentioned, and so, just to go back up, we’ve got the net amount, which is basically the difference between the price and the net amount left over after you take away Amazon’s cut. So if you’re selling a product for $20 using FBA, Amazon will take a cut off, for instance, $5, $6. So the net amount would be the remainder. So if you want to make sure, if you want to really make sure that you’ve got a good profit margin there, you could set the minimum to at least $10 or $15 so that you know, there’s that, that margin there. So that takes away Amazon’s product, also Amazon state, but it does not take away the product costs or the shipping costs to Amazon.
[13:00] Lenny: You do need to track those yourself. So we’ve said all about filters, selected our categories and performed the search. Now over on the right-hand side here, you can see the total number of results. So we’ve got about 750 here. And then you can also download those results to a CSV file so you can open that up in Excel or any sort of spreadsheet program later to to check it out. Now the information that you can see here, there’s a lot of the things that we’ve talked about. So you can see the estimated monthly sales on the right, you can see the number of reviews, which again is the competition and the average star rating is sitting just below that, the LQS is listing quality score. Like we mentioned, you can see the number of sellers that we’ve got on that particular listing, which personally isn’t something I worry too much about that. You can also see the weights, as well we’ve got the net amount and here’s the Amazon FBA fees.
[13:58] Lenny: And you can open that up. Then you can kind of get a breakdown on what those fees are. So essentially if you were to sell this product at this price, this is how much you would expect to pay Amazon in fees. And that would leave you with $12,11. And then from there, you then take away your product costs, if you can get that, say $2, and then maybe let’s say another dollar for shipping to Amazon. So you could say, OK, it looks like I’d get about $9.11 net after you take away those other fees. You have the ability to open up the listing on Amazon so you can view it there. We’ve also got this button here which then adds that product to the Product Tracker. And so we’ll talk about that in the moment that the Product Tracker is a way you verify the number of sales that you get.
[14:50] Lenny: So this is an estimate and we work really hard on making our estimates as accurate as possible, but we recommend sending products over to the Product Tracker because you can kind of drill down more and get even better data, by tracking that product over time to really be certain about the number of sales that’s getting before you go out and launch that particular product. The other thing you can do is that with any of these columns here, you can rank, you can click on them to a sort by ascending or descending. So if you kind of want to look at, um, the highest to lowest silos or lowest to highest reviews and so forth, then you can do that with any of these columns here to, I suppose give you some quick advice in terms of how you choose which products you’re looking at.
[15:44] Lenny: Because obviously they should all match the criteria that you’re already set here. The things that we recommend kind of looking for is you generally want products that are like fairly simple so that when they manufactured, if something does go slightly wrong, then it’s not going to be too big of a deal. That’s why we recommend prep staying away from electrical type products because there’s just more room and more risk of things going wrong. Whereas if you’ve got like a silicone spatula or something, if it’s made a little bit too short or something like that, it still functions as it should still be OK. So that’s what I’d keep in mind as you’re kind of looking through. The first thing I generally do is just sort of like look at the images and kind of go, OK, what’s going to be fairly easy to manufacture.
[16:33] Lenny: And then if you see an image that you like, I’d come over and double check, OK, how many sales are getting and how many reviews and so forth. Then we save a product, then after that, the next thing I would do is open that product up on Amazon and then perhaps look at some of the other listings in that particular sort of niche. So, you know, I would open this one up, let’s say I liked an electric heat pump even though I said we’d probably stay clear of electronic type products. I’ll open this one up on Amazon. And then, this one’s actually quite good because how many sales was it getting? It looks like we haven’t been able to get older. We haven’t been able to get, all the data from this one. So it looks like at this stage it looks like the estimate was about two and a half thousand sales per month, and which is cool because at the same time it’s only rated about two and a half stars.
[17:36] Lenny: So, it looks like people are still buying it despite the fact that it’s not rated that well. The way I would interpret this because it’s only got three reviews, I would say possibly this product has actually just recently launched and they might have actually done a giveaway promotion and been giving away a lot of units which is kind of boosted their best seller rank and perhaps given us some inflated results in terms of the estimated sales. So that is why it’s important to then send that product over to the Product Tracker. So, if I was interested in this product and I wanted to dig a little bit deeper, I would then add that product through the Product Tracker, which I guess brings me to the Product Tracker. So we’ll head over here, now, I guess, why would you want to use the Product Tracker?
[18:27] Lenny: Well, for the exact reason that I just stated is that we gave a estimated sales based off of a number of factors, but one of the factors is the best seller rank or the BSR, which is a rank that Amazon gives to all of their products based on how well it’s selling, okay. But if for instance, a new seller has done a promotion giveaway, then let’s say that this person is just given away a hundred units of their stock at 50% off. That means for a few days they’re going to get really high sales numbers, which then sparks their best seller rank, which then affects our sales estimates. So you’ve got these inflated sales estimate, it’s not sure whether this is the actual amount of this product would normally get. So the only way to be able to tell if it’s inflated it is to track that number over time. So you can come back every single day and look at the sales estimates. But that’s essentially what the Product Tracker does for you. So, um, you can come over here and it will give you real sales data as well as sales estimates. So let’s have a look at some of these.
[19:47] Lenny: There’s sales estimates. Alright, cards against humanity. That’s a good one. But I’ll leave this one open actually to demonstrate, in addition to just giving these sales estimates the Product Tracker can actually give you real sales data as well. OK, we do that by counting the inventory levels. So essentially if a product has 500 units one day and then they’ve got 450 the next, then you know that they’ve done about 50 units in sales in that period. OK. So we are able to show a real sales was data in the product track App. So, so we’re kind of run through all of that here. This example isn’t showing real sales data, it’s actually showing sales estimates. So, we’d still use sales estimates in the tracker times that we would show that is if, for instance that particular product has more than 999 in inventory and stock, that’s the maximum number that Amazon is able to, the Amazon shows us.
[20:49] Lenny: So when the inventory is above that number, we can’t actually save the real sales data. So we revert back to sales estimates also if that seller ads inventory, like they might have 401 day than they actually add more inventory back in on those particular days. We can’t calculate the difference in sales that we revert back to sales estimates. And then also if there are multiple sellers on a particular listing and the buy box owner changes the seller that’s in control of that listing changes on those particular days. We also revert back to sales estimates. So those are the instances that we use sales estimates. Otherwise you can also see real sales data. So the blue bars here are your inventory levels, the orange bars here sales estimates and we’ve got black bars as well which show real sales data. So I’ll show you the process of adding a product to the tracker and then we’ll also see if we can find some real sales data.
[21:55] Lenny: So if we come over to Amazon, we open up a listing, there’s a couple of ways to add products to the Product Tracker. You can either copy the URL up here in the top or you can copy what’s called the ASIN, which is just the unique identifier, the Amazon, keeps every product and the ASIN can be found in two places. It can be up here in the URL or you can scroll down. OK, I’ll just quickly breeze through this then. Sorry you copy the URL, or the ASIN and you paste it into the tracker and any moment now it adds it up here. And then this one, here is quite a good example. So you see these black boxes here are the real sales numbers. You can say that their inventory levels have gone down, they run out of stock and then it looks like that been out of inventory.
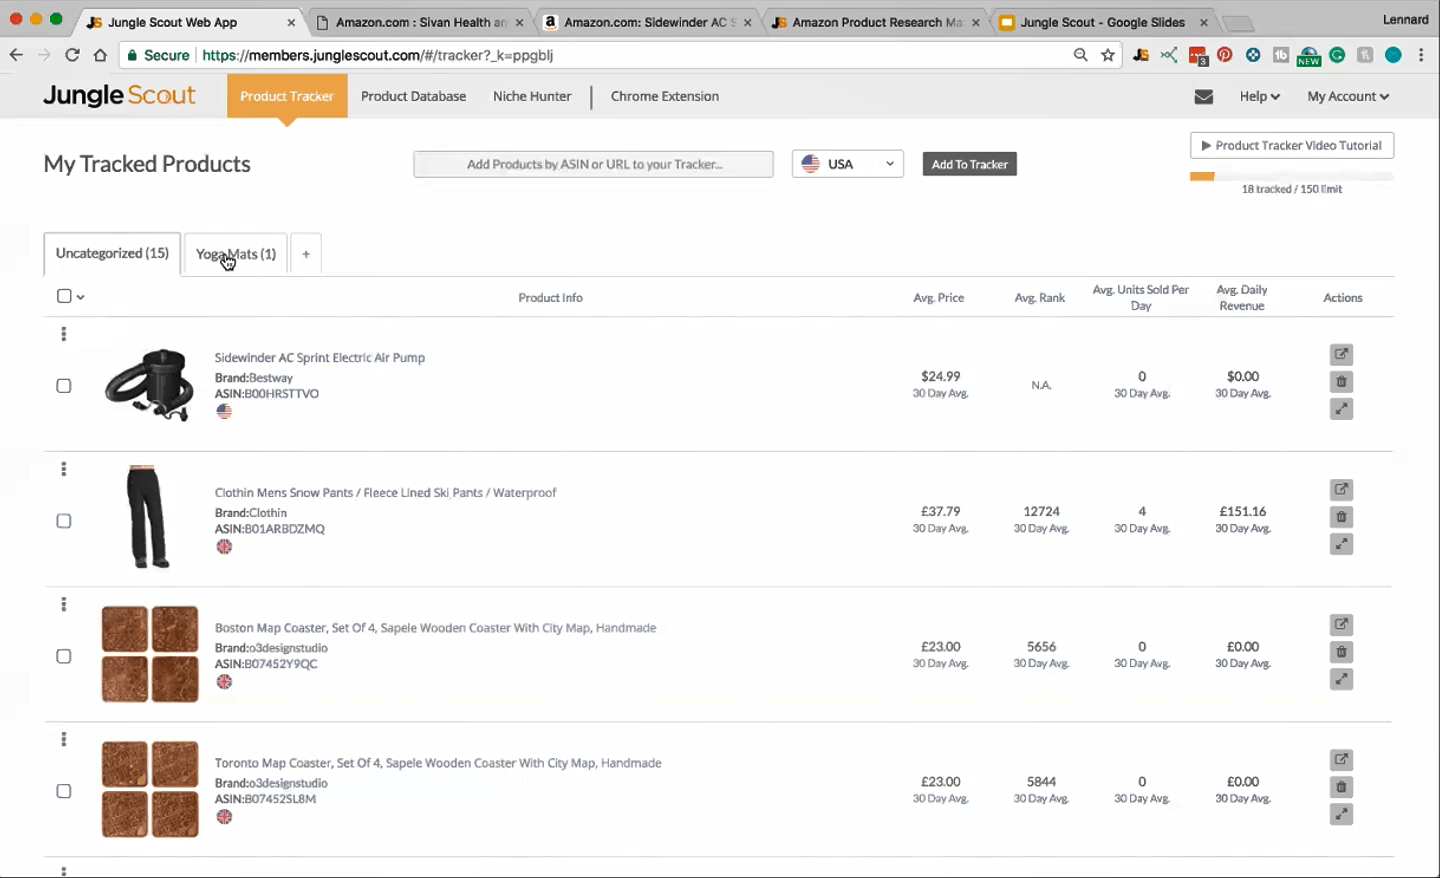
[22:50] Lenny: And then I added that back here. It looks like the inventory levels at this point keep 999, so we’ve reverted to sales estimates. You can see anywhere between 7 to 60 days worth of data. Essentially you can see all that same information on the right hand side that you can see in the Product Database as well, which covers all those different elements. Essentially that’s the Product Tracker. The other cool thing you can do is that you can create little categories here. So let’s say I wanted to create one called Yoga mats. You can then click and hold on one of these items and drag it over and then that one comes across into this, little category. It’s just a really good way to kind of keep your product research organized. So did you have any questions?
[23:54] Augustas: Yes, I would like to know sales estimate. I saw some sellers were speculating how Jungle Scout calculates sales estimate. Is it the last month? Is it for today, is it average of something?
[24:13] Lenny: So we’re constantly working on our sales estimates and we’re working on a new system called API sales, which is, way more accurate than anything that waived on or that we believe that anyone else has ever done in the past. Traditionally, sales estimates came from looking at the bestseller rank of a particular product and just, I’m basically making an equation that goes, if the best seller rank is this then the estimate is going to be at this. OK. So it was kind of like a basic equation. So what we’ve done now is that we take into consideration a number of factors. So we do take into consideration the best seller rank. But it’s not really the best way to look at sales estimate. So we’ve got access to a lot of real product data as well. This is from people within the Jungle Scout team and people that we know, but also we’ve got a lot of sellers that have anonymously, allowed us to see their sales data.
[25:16] Lenny: So we’ve got a lot of real data that helps us create sales models of it, we also look at a lot of historical data as well. So we’ve been collecting historical data for years because we were the first company to start doing product research. We’ve got the most historical data over time, so we’ve been able to kind of plot how sales numbers and then how it’s changed over time, if that makes sense. So we use historical data, we use real sales data, we use the bestseller rank, and so we kind of combine all these methods to create a sales estimate. So really it’s a combination of a, of a, a bunch of things. But if you’re asking what time period or if you’re looking at a sales number and let’s say its 500 sales per month, that says that based of today, we’re estimating 500 sales in the next month, if that makes sense.
[26:26] Augustas: Yes, it makes sense. So now I understand that it’s very complex formula and you shouldn’t be afraid of Black Friday’s numbers or something like that?
[26:37] Lenny: No, no, absolutely not. We’re, constantly working on models as well to kind of like, account for situations like that where you’ve got, the Black Friday or something that has a huge spike or sometimes you do just have weird outliers outlying numbers that just too low or too high that it just kind of strange. So we’ve got systems in place to cut out things like that and to anticipate and workarounds and things like Black Friday.
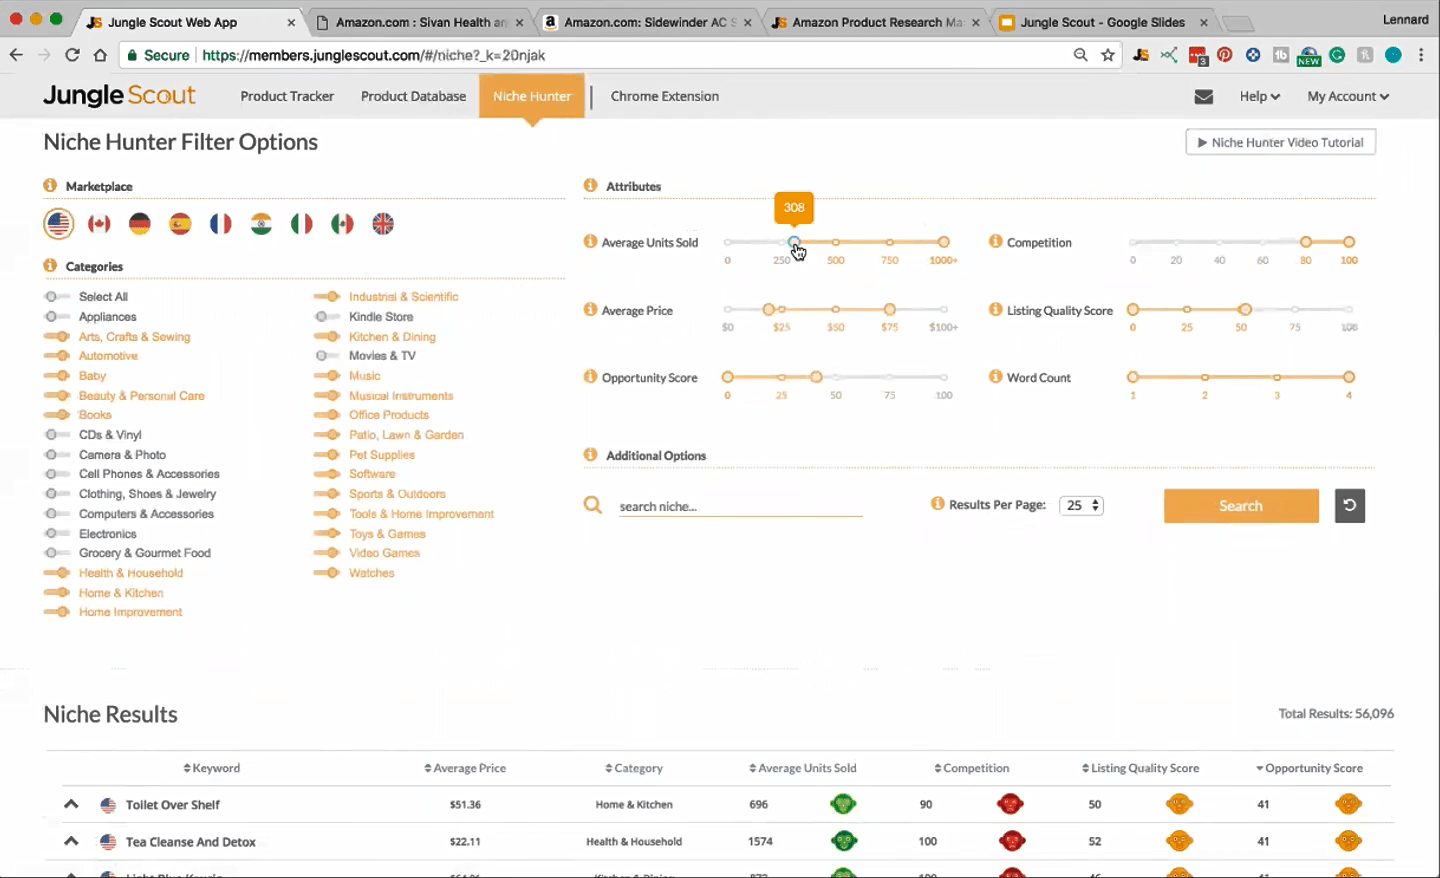
[27:16] Lenny: So I’ll quickly talk about the Niche Hunter. So just to quickly go back to the production database and the Niche Hunter help you find product ideas and then you take them over to the Product Tracker to really drill down on the sales. So the Niche Hunter is just a different way to find product ideas. If you come over here, you’ll see that it is very similar to the Product Database.
[27:36] Lenny: You’ve got your categories and you’ve got these filters here. This slide is instead of being able to input numbers, but essentially it’s very similar. So average unit, that’s your sales. Average price. You’ve got a new filter here called Opportunity Score, which is exactly what it sounds. It’s just, it’s a combination of the demand, the competition and the listing quality score. And so we’ve created this new sort of, algorithm called the opportunity score with the higher the number, the better, the opportunity. Of course you’ve got competition again and listing quality score. Now what is the Niche Hunter, how is it different to the production database? Well, what it does is rather than giving you individual listings, it actually gives you keywords. OK, so these are keywords that I searched for on Amazon. And then beneath those keywords, it displays the top listings that appear beneath that keyword.
[28:39] Lenny: You search this on Amazon. These are the top listings below it. And then what we do is we give you an average of the units sold and at the competition and the listing quality score and so forth. The reason that you would want an average of say, those top 10 listings is because even if he finds wanting to vigil listing, let’s say it’s a yoga mat, it’s suddenly got 30 reviews and it gets 500 sales a month. That looks right, but you really do need to look at the entire nation. So what you would do is he would come over and type in a yoga mat and then you need to look at all the top listings. Because if you’ve got one that has low competition, that doesn’t mean that there aren’t plenty of the listings that have lots of competition. Therefore, meaning, it may not be the greatest opportunity to go into.
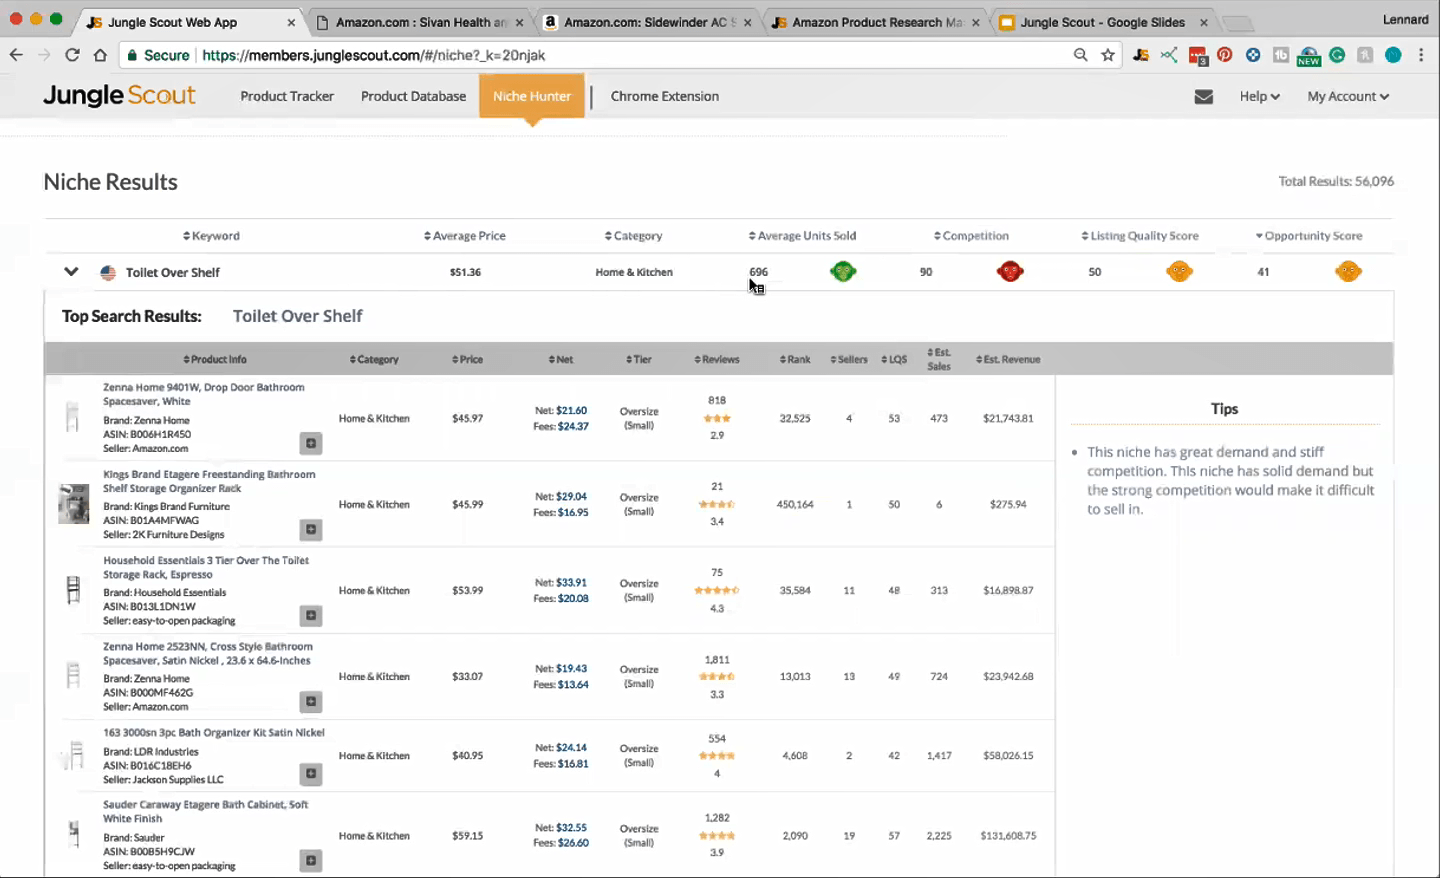
[29:30] Lenny: So in other words, you really do need to look at the entire niche and not just a single listing. And so what’s cool about the Niche Hunter is that it does that for you. So it gives you the keyword and then it shows you an average of all the top listings, the neath, that keyword. So you can see that the average unit or average sales per month is quite high. You’d ideally then be looking to see that the average competition is quite low. So, it’s just another cool alternative way to look at products. In this situation, I’ve deliberately selected high competition and low opportunity score just so I could show you sort of the scale here, all the legends, so at a glance, a quick look at this as of course green they’re little monkeys here, the green monkeys are a good value.
[30:28] Lenny: The red of course is a bad value and orange is kind of a medium average value. OK. So that’s a really quick way to look through and see which ones are good and worth investigating or not. So you’ve got all these keywords. We do have a lot more keywords than we do product listings. I think we’ve probably got like 40,000,000 or so in our Product Database in the Niche Hunter we’ve got millions more. So you’ll say that in this particular search we’ve got 56,000. So it does take a little bit more sifting through to find keywords that look like they could be good products are ones that might interest you. Let’s say Harry Potter paperbacks that you probably wouldn’t sell that because it’s not really private label. You obviously couldn’t really sell that, but essentially what you would then do is let’s say you’ve got high numbers of units sold, low competition than what you would do is to check how well those are spread out.
[31:37] Lenny: You want to make sure that I’m, because keeping in mind that this is an average, if you’ve got a low competition score as an average, you want to make sure that one listing doesn’t have really high competition with like a thousand reviews. And then all the others modernly have 10 reviews. So the average of that is quite low, but it’s because you’ve actually got one listing that’s really high and then the risks are really low. So you want to just double check the averages. So you want to make sure that the reviews and the site was a fairly evenly distributed, but once he checked that, essentially you can view all the same information that you can in the production database or the Product Tracker here, the stuff we’ve gone through. Then if you liked that product, you can go through and again, add that one through the Product Tracker.
[32:31] Lenny: And what I would recommend here is it you add all the top listings to the Product Tracker. So usually it will be up to the top 10 listings. So I would go ahead and add all those up to 10 listings to the Product Tracker so that you can see all the sales data, all those particular products. And I would recommend tracking them for at least a couple of weeks ideally. So you can track all those products for a couple of weeks and get a really solid idea of how many they’re selling, then you can use that information to go to the next level if you choose. So that in a nutshell is kind of a Niche Hunter and sort of the process to go from the Product Database and Niche Hunter over to the Product Tracker. So I’ll see if you’ve got any questions Augustas and then I’ll move on to the chrome extension real quick.
[33:26] Lenny: OK, excellent. So the chrome extension runs live on Amazon and I’ll open this one up here and say what this does is it gives you live sales estimates immediately. So the advantage of this is that if you’re ready to have a bit of an idea about what you want to sell, you can go onto Amazon.com, type in some keywords and then, you know, so essentially then in there you can bring this up and it just gives you a really quick idea of how well that niche is. So if I run it on this page, you can quickly see all the sales numbers here. I’ll have a quick overview of the reviews here as well. And then all these other columns that we, we talked about that you’ll find in the, in the web App, you can see it all here. You’ve got your listing quality score, your net amount, all that data, their OK, you can actually like extract, extract multiple pages as well.
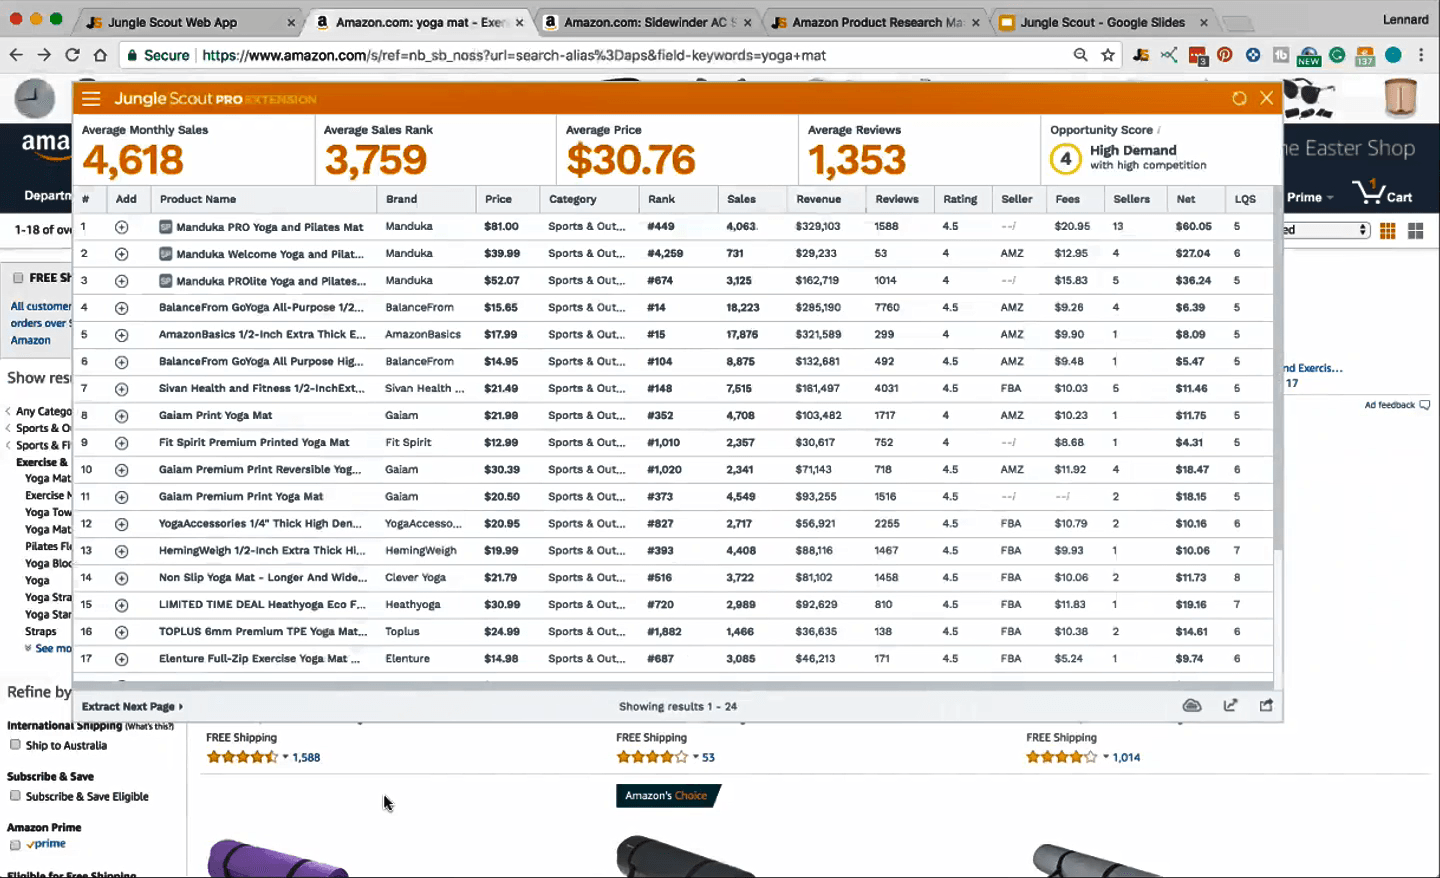
[34:22] Lenny: So we’ve got 20 results on this page. We can hit extract and we can view more results too. One really cool thing that we’ve added recently is this opportunity score. So if you don’t really have an idea of how to look at this data or how to interpret it, we just give you an opportunity score here, with essentially up to 10 being an excellent opportunity. One being a poor one, just to give you a ballpark idea as to how good this particular of a niche is. We’ve got averages up the top here for the average price, the average reviews. So really it just gives you a very quick overview of how in this particular niches, you can filter your results as well. So if you only want to see the results at a certain price or at a certain sales number and so forth, you can send in minimum maximum once he can see some additional filters – standard, oversize, you can look at all of that. Then you can toggle on and off different columns here as well. You can check any of these columns here or if this is too crowded, you can pull out any that you don’t want to see.
[35:43] Lenny: At a broad level, that’s really the Chrome extension in a nutshell. Do you need one or the other or both? You don’t need both. Generally speaking, if you have no idea what you want to sell then the web app is a good idea because it just generates those product ideas for you. If you have a little bit of an idea in terms of what you want to look at and you just want to type stuff into Amazon and explore those niches than the Chrome extension is really good. However, you know, they absolutely do work very well together. So you don’t need both, but they do work well together if you choose so.
[36:22] Augustas: And on the Chrome extension, there are three icons at the bottom right, what do they mean?
[36:38] Lenny: You can actually check a Google trend report. So that gives you a good idea of seasonality because generally speaking, you don’t want to find something that’s too seasonal. So for instance, Christmas tree lights, if you’re looking in December and November, you might go great. They’ve got a lot of sales. I’m going to sell that product on only to discover when January and February come that you’re getting no sales. So ideally you want products that sell fairly well all year round. So, again, just to show you this little button down here in the middle is the Google trend report. So, Google trends is a great way to get a bit of an idea of the seasonality of a product. So let’s change this stuff to the past five years so you can see how this is done over time.
[37:18] Lenny: This is a product that’s fairly well distributed but if we would go Christmas lights, I’m sure there’s going to be a different story here. So, this is what you don’t want to see is that it just spiked one time a year and then you can look the rest of the year that the search volume is very low. So I do want to note that this is based on Google data. This isn’t based on Amazon product data. So, it doesn’t translate directly across, but it just gives you a good idea of seasonality. So that’s that one there. Over on the very right here you can share you can share these numbers, what a lot of people do. We’ve got a Facebook group with a lot of sellers in it and there are lots of other Amazon seller groups as well.

[38:13] Lenny: If people ever want feedback on the numbers that they’re getting, you can actually share a screenshot of this. It hides the product so that you don’t need to share the product, but it will just show all the numbers, sales, reviews, et Cetera, et Cetera, and you can share that with friends or family or in a Facebook group and just get feedback like, hey guys, do you, what do you think of these numbers? Can you help me interpret them? So you can export that two to share on social media or with friends or family. And you can also export a table. So again, a CSV file to look in, you know, excel or something later to kind of view this data further. And then we’ve got this fun little, this is a fairly new feature. It’s like a little word cloud. So based on all the products that you’ve seen, all the listings on this page, these are the most common words that come up.
[39:07] Lenny: So this could help you out a little bit in terms of picking up some of the top keywords that you might want to write for, or keywords that you might want to include in your list that appear a lot. So the bigger they are, the more often than they appear, but you also see how many times they appear and so this is from, their title and description and everything. So this is just a cool little tool to pick up some main keywords. You’ve got the very top keywords down the bottom here, which of course is like Yoga Mat, exercise, pilates, thick, and you can sort of download that one as well. So those are some cool little additions here.
[39:53] Augustas: Alright, probably we’ve covered most of the things of the functionality. I know Chrome extension has two versions, the Lite and the Pro. What is the difference?
[40:10] Lenny: Actually, I’ve only got the Pro extension available here that, essentially the main difference is that some of these fields aren’t available things like the Amazon FBA fees in the light version you can only see kind of the basic categories here. You don’t see things like the fees or the number of sellers and more or less these ones here liked product dimensions, product weight, Tier, and the Amazon FBA fees. So you don’t see some of those or you don’t see those in the light version. Whereas in the pro version you get to see everything.
[40:48] Augustas: Yeah, everything is covered so shall we go over the pricing?
[40:53] Lenny: Yeah, absolutely. I’ll just bring up the home page here. All right, so, we’ll start with the web app here. So, essentially we’ve got three different tiers. We’ve got the startups, standard, and business. So the startup begins at $39 and essentially that allows you access the Product Database. The Product Tracker, you don’t have access to the Niche Hunter and in the Product Tracker. You can track up to 40 listings at one time. You can always delete some and then add some, replace it with new ones, but you can only track up to 40 at one time. Then the standard and business memberships, they allow you to use the Niche Hunter tool in addition plus they allow you to track the products. So the standard allows you to track 80 and the business allows you to track a 150.
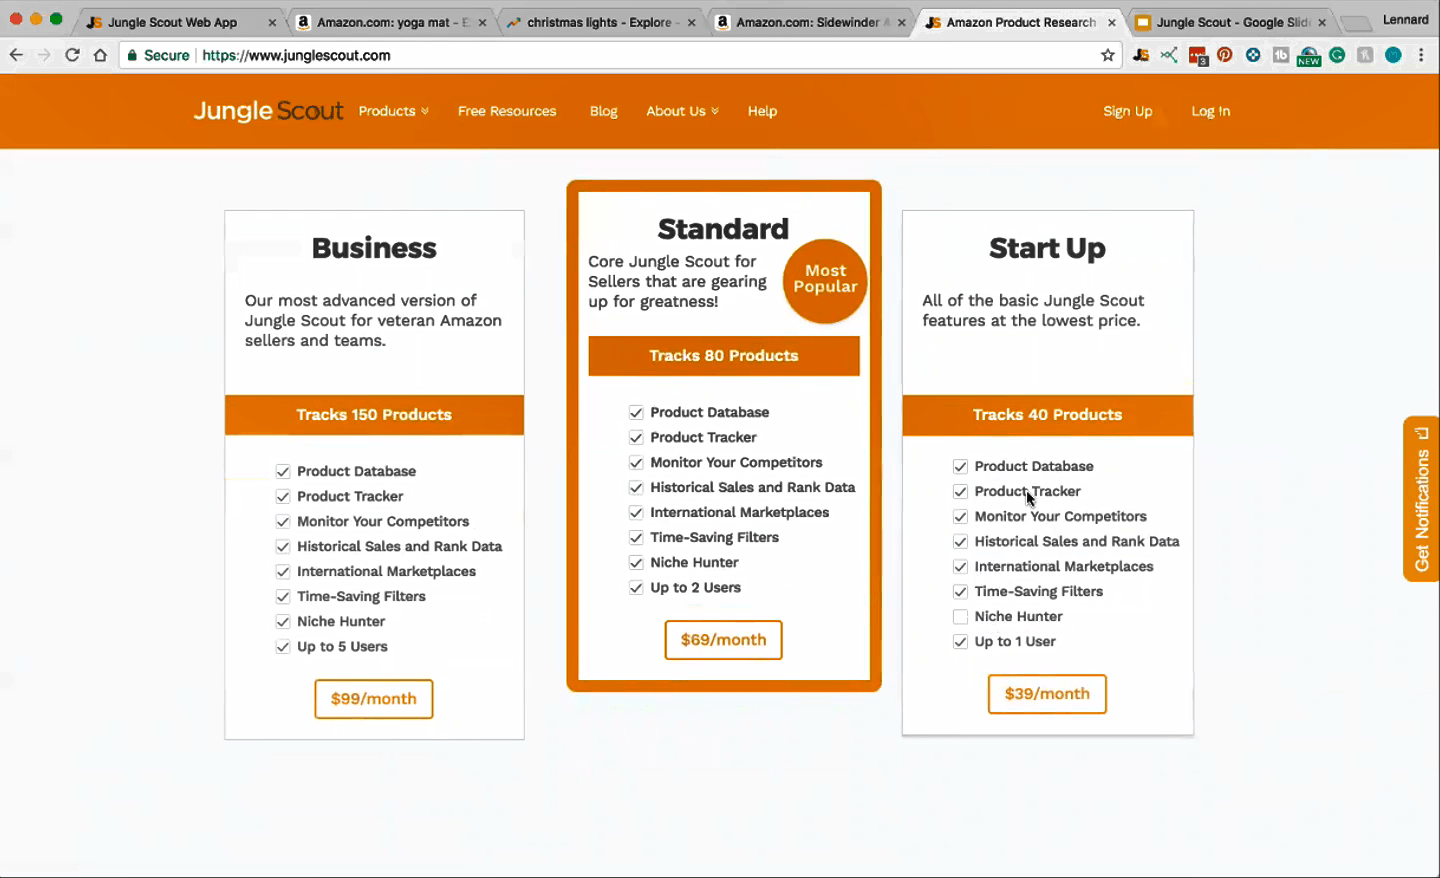
[41:50] Lenny: The standard is $69 a month and the business is $99 a month. So that is a month to month billing. We do have an option for annual billing. Which you will see kind of brings the monthly price down. Of course, it is billed annually, but if you go with the annual billing then you will save up to I think 30 percent on the yearly costs. So you’ve got a couple of options there whether you want to do monthly or annual billing. And so those are ongoing. Those are subscription based. Where’s the chrome extension is just a once off payment. So the Lite version is $97 and then the pro version is a $197.
[42:42] Augustas: Are you planning to release any other features in the near future for the users?
[42:54] Lenny: Good question! So, at the moment we’ve actually gotten a whole redesign of Jungle Scout coming out very soon. So we’ve been working a lot on that one. So OK, at the moment our main focus is just to take what we’ve got there, make it faster, make it better, make it a better user experience. So we are just focusing on making it better at this point, but we do also have a few other things coming up. One thing that we always are doing is that we’re always improving our data. We’ve got a full-time data science, a scientist, and engineers that are always working on making sure that that data is accurate and otherwise monitoring that. A few, a couple of other things that we are looking at in the plot line is that we are looking at bringing in some keyword research tools and we’re also looking into mobile apps as well so that you’d be able to Jungle Scout your way on the run. So those are a couple of things.
[43:50] Augustas: It’s always nice to see how the software is evolving. And the final question, support is very important for me when I use any kind of software or service. How fast is your support and how people can get in touch with their support team?
[44:09] Lenny: OK. So they can get in touch with us via email and we’re also working hard on live chat as well. We believe that customer support is incredibly important. We’ve always placed a huge emphasis on it. I’m probably a little biased. I believe we’ve got like one of the best, if not the best customers and customer support teams out there. Currently. We’ve got 11 staff working in the customer support team from multiple continents so that we can cover all the different time zones. I believe we almost covered 24 hours at the moment. I think we cover about 20 hours so of the day. We’re getting close to having complete 24-hour support. We’ve got crazy busy in the last few months and so currently our response time is about 24 hours. But we are working hard to get that down 12 hours, very soon. And then our goal is to get that down to 4 hours. So we’ve got a huge team there from all over the world that’s trying really hard to get the support as good as we can.
[45:23] Augustas: 11 team members just for the support. That’s huge.
[45:27] Lenny: Yeah, absolutely.
[45:34] Augustas: Thank you Lenny for this demonstration of the Jungle Scout and good luck in your business!
[45:36] Lenny: Cool. Thanks so much for the time Augustas. It’s been a pleasure.