Gorilla ROI is a Google Sheets add-on that allows you to connect and import data directly from your Amazon Seller Central account into Google Sheets.
Instead of exporting and manually processing the numbers, you can have your existing spreadsheets update by itself. Get direct and flexible access to your Amazon data without having to know the code.
By using the tool, you’ll be able to do things like bulk convert your ASIN’s to SKU’s or FNSKU, breakdown the fees and charges per SKU, pull historical inventory level for projections, load the number of units sold by month, week, last year, last month and more as well as streamline your data and work so you can focus on more important things in your business.
All these things are explained below in the blog post.
What is Gorilla ROI and what’s it for?
The team behind Gorilla ROI are Amazon sellers themselves. In the past, they used to subscribe to 3-5 different software, depending on what they were trying to achieve in the business.
Unfortunately, it did about 80% of the functionality that they needed, meaning the remaining 20%, you’ll still have to manually log into Seller Central, export data cleanup, excel files, organize it and then upload it onto spreadsheets and share it with the team.
And once Jae Jun, the founder of Gorilla ROI, got to a stage where he had to do it too often, it became much more expensive, and didn’t have up to date data on hand.
Plus when their team needed a specific up to date data point, it wasn’t immediately available. And so there was a delay as a result.
Since they use Google sheets a lot to share numbers between the departments, that’s where the idea came about.
Now Gorilla ROI pretty much automatically imports our cellular data straight into Google sheets, just like how you can install like an extension for Google chrome. They’ve done the same thing by extending the functionality of Google Sheets.
So in its simplest form, if you had to explain it in like one sentence, Gorilla ROI allows you to load your seller data straight into Google Sheets. And the problem it solves for Amazon sellers is that it automates the manual spreadsheet process. You can get rid of that work that doesn’t really add value to your business – it eliminates the errors related to just copying, pasting, and so on.
And you have the flexibility because now you can pretty much pull the data and the information that you need as opposed to just using whatever Amazon gives you. That’s the type of problem that it solves for Amazon sellers.
Who can use it?
There’s a very clear idea of who is going to benefit the most. And to split it up, Gorilla ROI is for 2 types of Amazon sellers:
- The first type is a seller who is just running a single seller account.
- And then there are sellers with multiple accounts like agencies or bigger sellers with like five different accounts.
And so for the first one, the best user fit is if you are data-driven and analytical, if knowing your numbers, or your client’s numbers is important and getting it fast is high on your list, then this is definitely for you.
Secondly, it’s important whether you do FBA only because Gorilla ROI does not support FBM like fulfillment by merchant and you need direct and flexible access to your data. Then this tool is for you.
There is no other tool on the market at the moment that gives you as much direct and flexible control as what Gorilla ROI provides.
And third, we highly recommend it to sellers who are doing at least 6 figures because that means you have at least 7 SKUs. Once you do 6 figures, the time that it takes to maintain spreadsheets takes way longer than if you’re a small seller.
Things to keep in mind before considering Gorilla ROI:
- if you’re brand new or you don’t have many SKUs, then this isn’t going to be the right tool for you since you can probably do it manually and save cost that way.
- You need to be like a data-driven, analytical person.
- You need to make at least 6 figures in revenue, or at least seven SKUs and above where it starts to take time to start following and tracking your products.
How to use Gorilla ROI
Right now we”ll take you through the process of how this add-on can be applied to your Amazon FBA business.
Once you’ve logged in to the dashboard, on the left you’ll see all the features that you can access using Gorilla ROI.
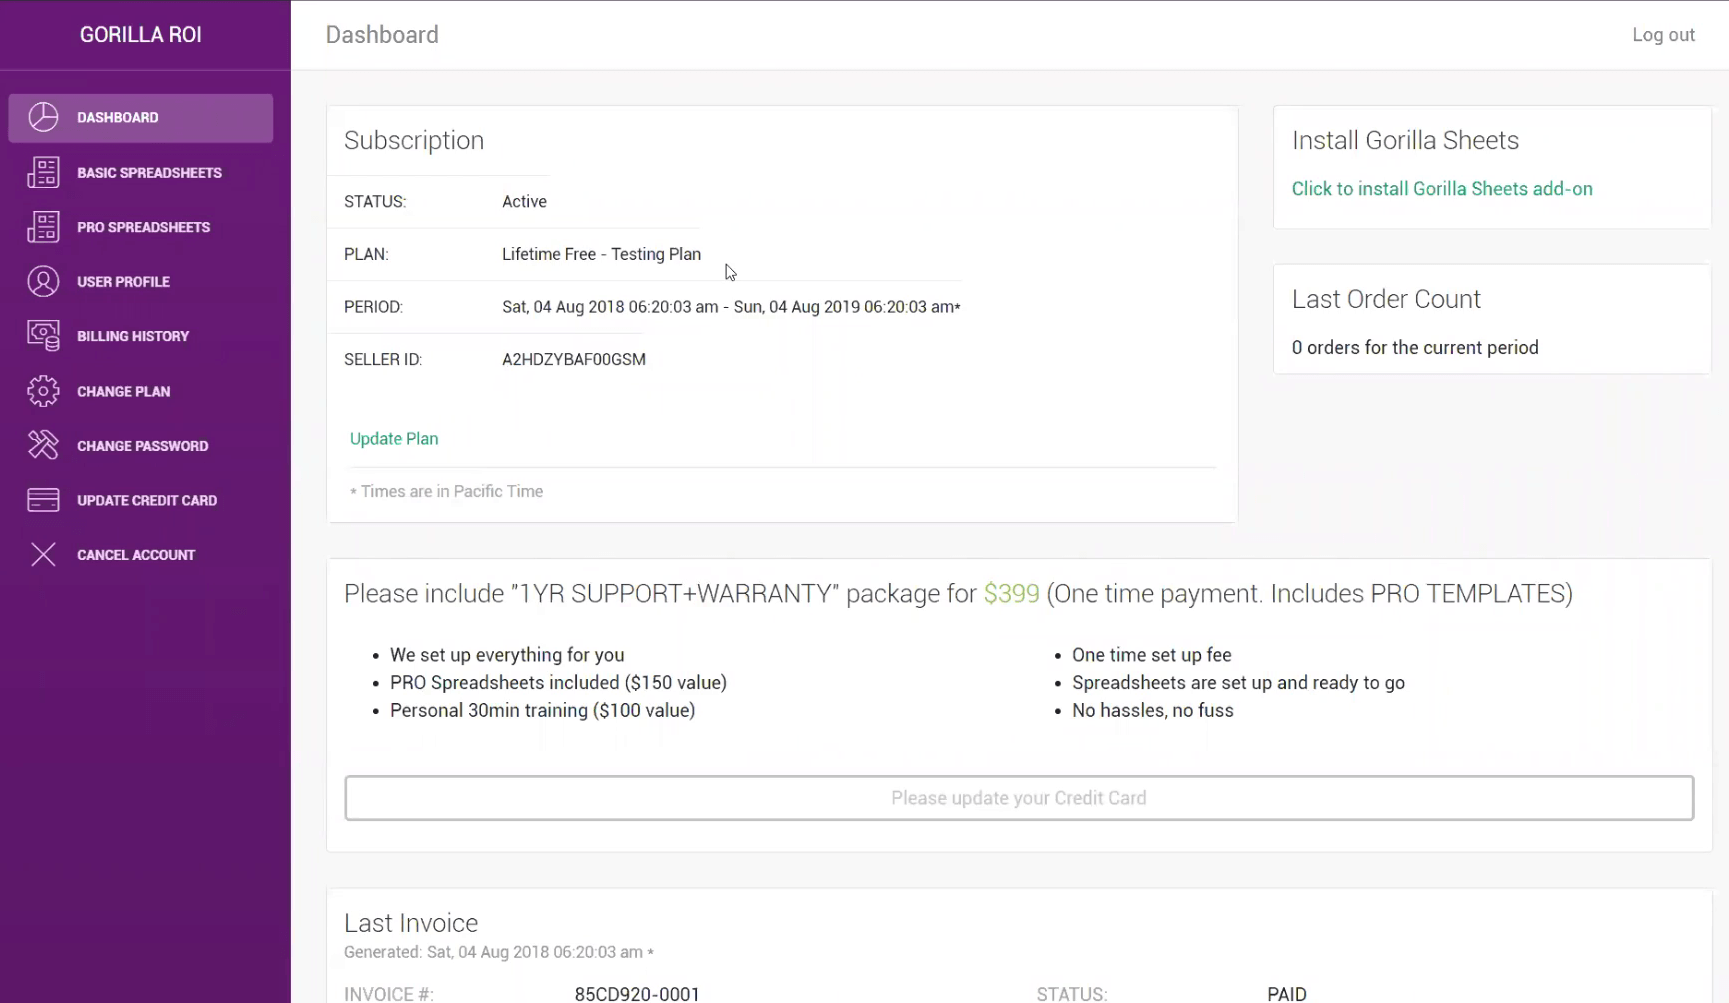
So the first thing is we want to show you is the training spreadsheet. It pretty much encapsulates the stuff that you can do with the add-on and by being able to pull the data.
Our test SKUs is AAAA1111 and another one is BBBB2222. So just for the sake of this demo, we just manually type this in to get data and product information related to this SKU.
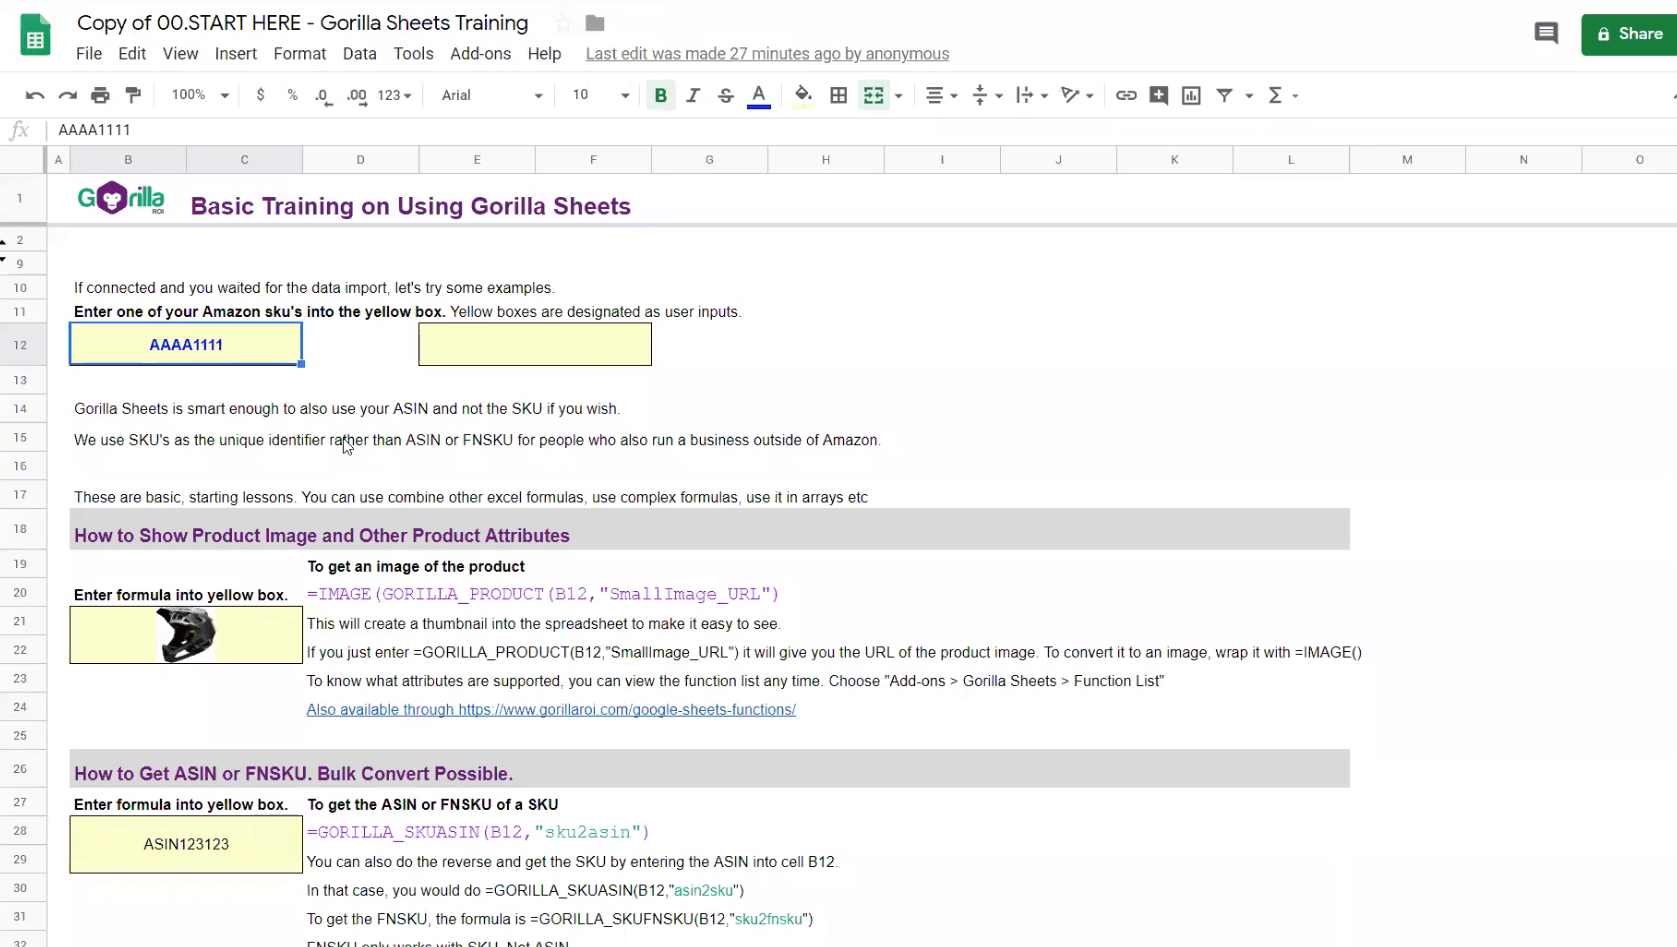
As long as you’ve used spreadsheets, it’s exactly the same thing except you’re now going to use the custom formula that would start with equals. And then you see all these different functions that the tool support.
One of the things you can do is to transform your SKUs into ASINs. For it, we’re going to do Gorilla Underscore SKU ASIN.
Profit and loss reports
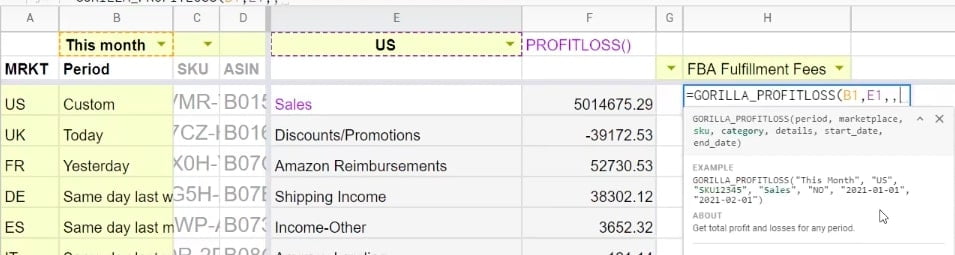
You can create your profit and loss reports for any specific time period. The formula itself is very easy to use – you just start typing in “=gorilla_profitloss” and choose it from a drop down.
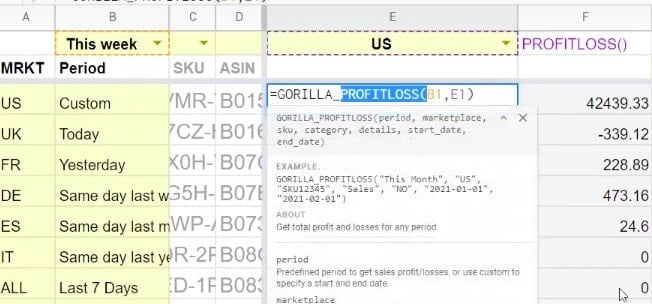
Now just follow what information you need to fill in. Because it’s a Google spreadsheet, you can make things very customizable. For example, you can change a time period in this column and the formula will automatically change as well.
However, you can do custom periods as well. For this, you would need to manually enter a date in the formula.
You can actually drill down even more into some of the numbers. For example, if you want to see what Amazon FBA fulfillment fees are made of, type in “=gorilla_profitloss” in a new column, choose a time period and marketplace. Now you can specify a specific SKU that you want to analyze or leave it empty – in this case, it will show your fees throughout the entire account.
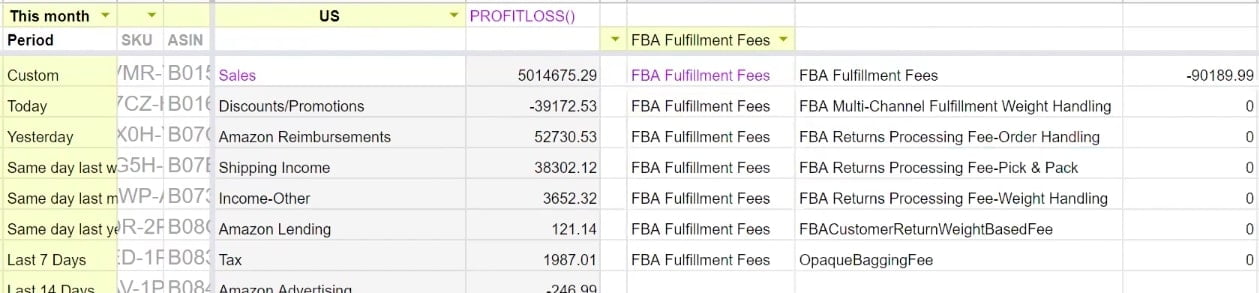
Here are other categories that you can analyze:

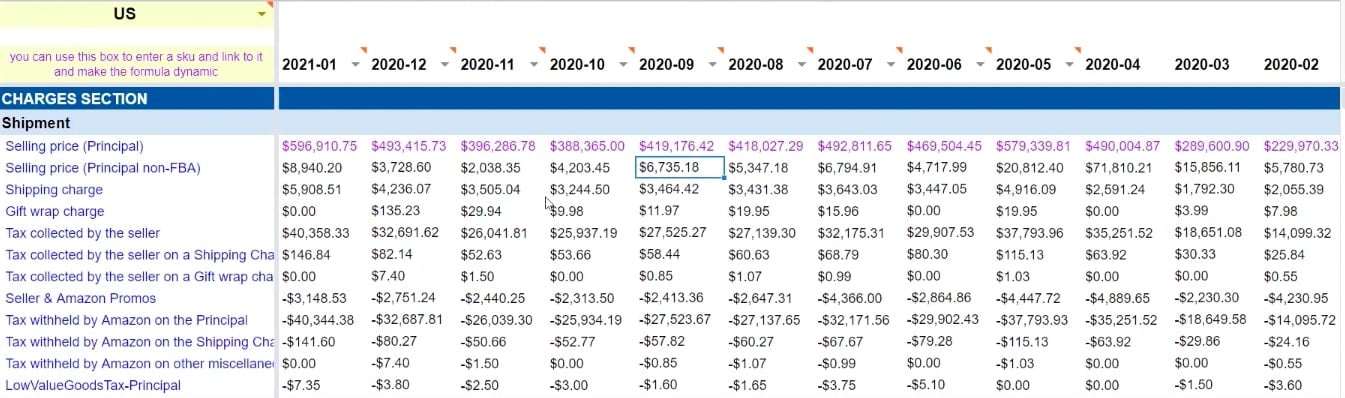
When it comes to more thorough reports, you are able to create yearly, quarterly, or monthly reports, where you can see a breakdown of your finances.
Reviews data
One of the things that you can do with Gorilla ROI is to improve your marketing campaigns using the information from your reviews.
Having information on your reviews enables you to see clearly where do you need to improve. Easily pull the data for specific SKUs by entering this formula:
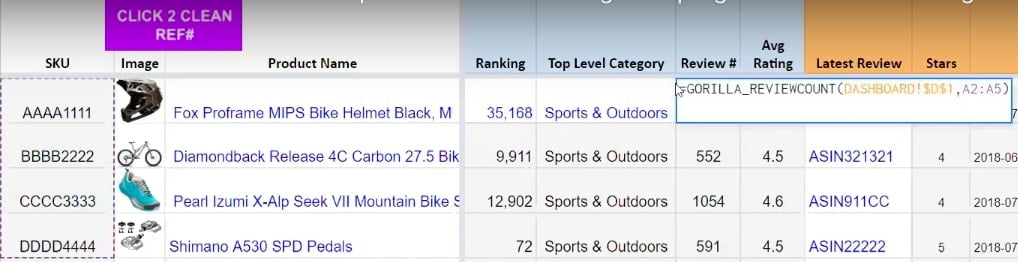
Even more, you can check how many reviews you’ve got during a specific time period. Here’s a formula for this where you can specify which marketplaces you want to look at and which SKUs.
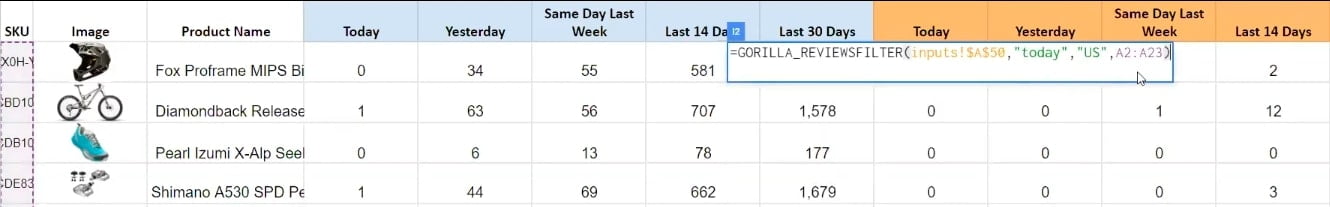
So now that you know how many sales you’ve done over the last 30 days as well as how many reviews you’ve got, you can break down to how many 1-star or 5-star reviews there are.
For this, all you need to do is to copy-paste the previous formula and add “1” at the end if you want to filter out 1-star reviews:

Depending on which reviews you want to get, change the number at the end of the formula. Also, you can customize the time period as well. So all in all, you have your sales and number of reviews for a specific time period in one place.
So let’s say you are running Facebook ads and want to know how do they perform each day, each week, what works better and not, you can use this exact data to track its performance.
Here’s the video where Jae Jun shows the step-by-step process:
Sales data
Imagine you can track your sales data for all your SKUs for a specific time period in one spreadsheet.
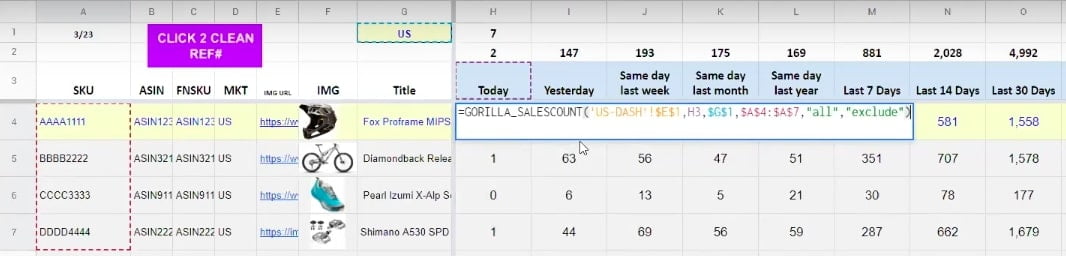
It’s not only reviews data that can be pulled out using Gorilla ROI. Besides reviews, you can also track your sales data as well. So how to import your sales data from Amazon Seller Central into spreadsheets using Gorilla ROI?
Here’s the formula to use – in this case, we want to see how many sales these exact SKUs has generated today for the US market:
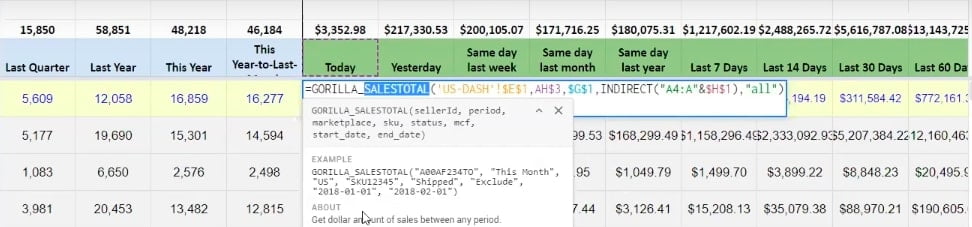
If you also want to see the revenue, the formula is pretty much the same – instead of “GORILLA_SALESCOUNT” you write “GORILLA_SALESTOTAL”
All of it lets you to project and forecast your Amazon sales trends as well as helps to improve inventory management.
Also, we have a separate video covering how to automatically pull out your Amazon sales data into Google spreadsheets.
Convert SKUs into ASINs
It automatically converts your current SKUs into ASINs. So if you have like a long list of SKUs that you want to get the ASIN for, now you can also copy and paste or export the data easily. Think of how much time this is going to save, especially if you have like 1000 SKUs or 1000 ASINS and you need to quickly grab the SKU or the ASIN or vice versa.
The second thing is you can grab product attributes. For this, just grab a new image.
You can add extra functionality if you want the image from like the UK marketplace or US or France or Australian marketplace, it doesn’t matter.
The URL for the actual image that you are using will load. Now if you want to get the image version of that, all you have to do again is just put a function inside the image and then it automatically converts that into the image. In this way, you can grab all the thumbnails and load them onto your spreadsheets.

Let’s say you want to grab all your ASINS in a current account. You can add and define which marketplace you want to grab it from. Like if you have UK and just want to grab from the UK account, you can type and say, “_UK” and then do that.
You can do other things like the product category, where this product is helmet product that you got set up is under sports and outdoors. You can even go further down and get the exact category of the product. On this one, this formula pretty much shows you how much inventory you have in stock.
By having these inventory data specifically, you can do things like really projecting and getting a better idea and get up to date value of how much inventory you have, how much is being transferred, how much is being shipped inbound, and that way you get a much up to date idea of your inventory forecasting and projections.
And so that’s how it works.
Let’s jump into another example. So again, this is a template that you can copy it directly over from your account. If you click it, then you can make a copy directly over to your account and save it to your Google docs.
Right now we are grabbing the ASINs automatically. And if you look at the information or the formula based on this SKU, you can now pretty much create any sort of custom template that you need.
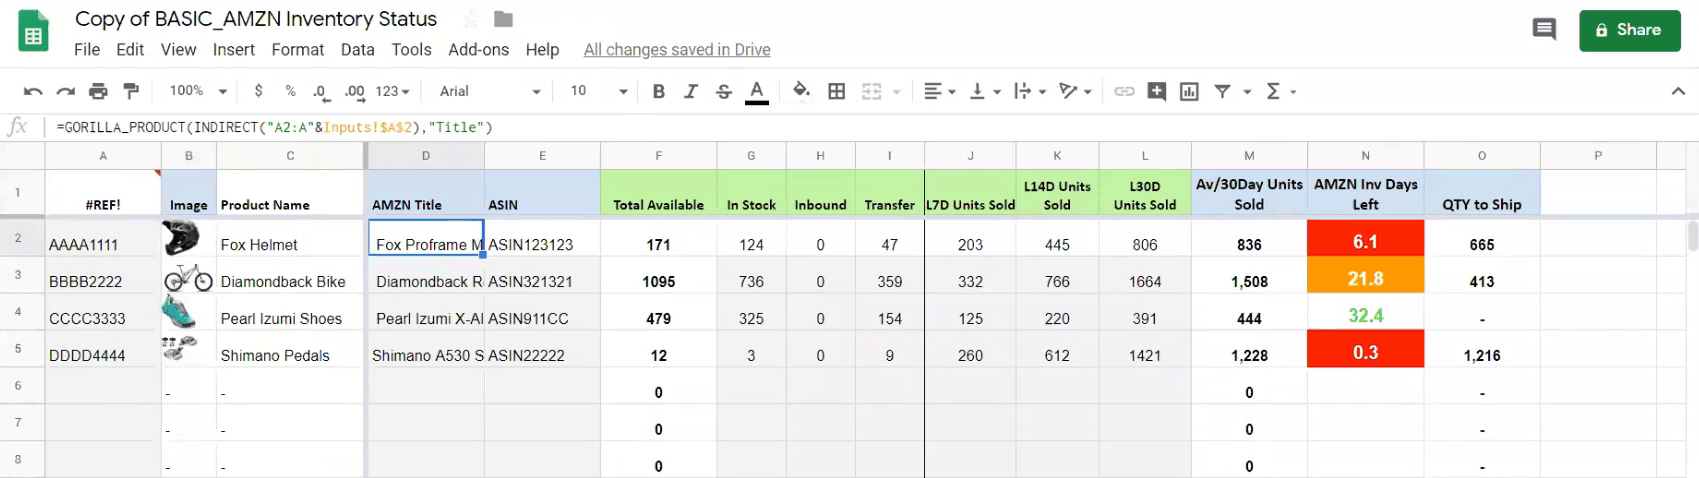
You already have the images here, as well as the product name from Amazon, all the product names, matching ASINS, you can see the total amount of inventory on hand. And so this really gives you an up to date data.
For sure you can see it on Amazon directly when you log in. But when you have hundreds of different SKUs, it becomes very difficult to actually get a really good understanding of your numbers because they’re just so much going on that page.
Inventory management
You can customize and create your own inventory quantity to ship. This is just a basic formula that Jay created where he was selling this helmet product. He’s calculated that he has about 6.1 days of inventory on hand. So he created this formula that you can get if you want to get your level back up to 25 or 30 days.
There’s a dashboard version of this so that you’ve cleaned it up and can see how many products are left, how many are being sold, and how many to ship.
And so these are just some of the things that you can do if you have data on hand. Gorilla ROI has clients who have to manage multiple different accounts. So they’ve created different dashboards for each customer or each brand, so as to keep things separated and to really get an idea and really stay on top of their numbers.
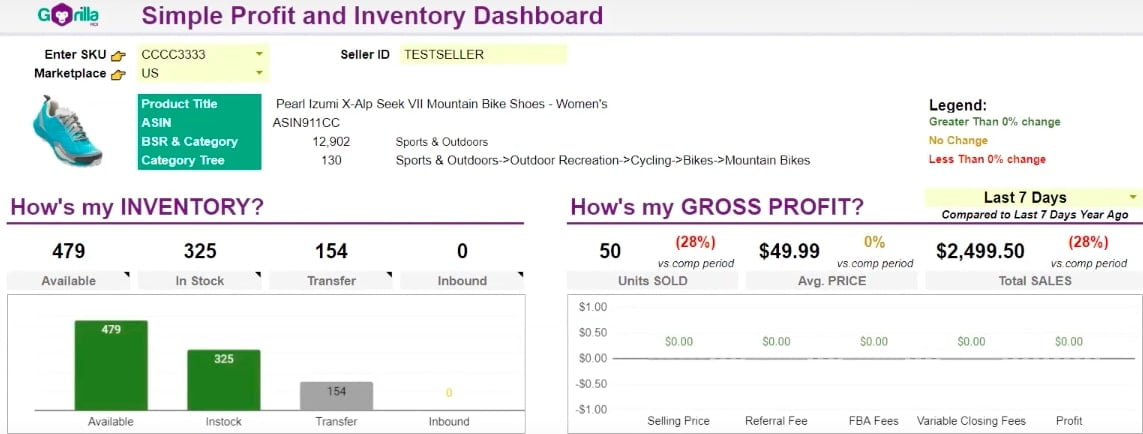
In regards to inventory, you can pull out the data to see your stock and your profits in one place. Gorilla ROI offers a template for a simple profit and inventory dashboard where you only need to enter an SKU and select a marketplace as well as your preferred time period.
Sales trends
The second most used template that Gorilla ROI offers for people is this one:
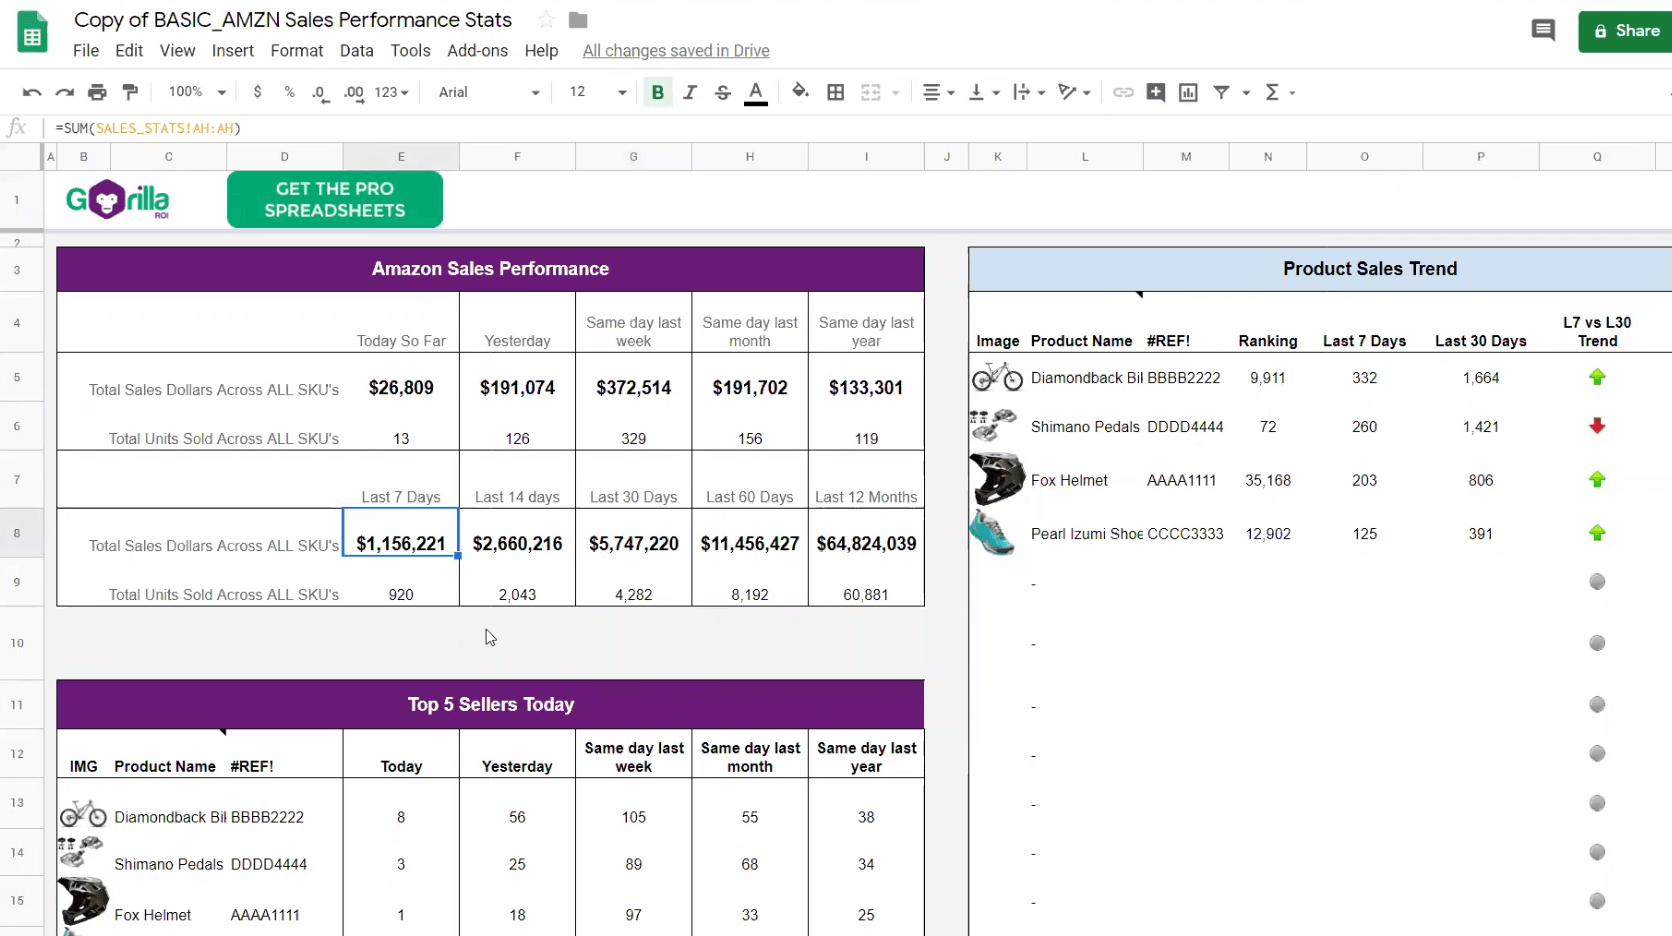
When you go to Amazon Seller Central and you’re trying to filter your dates, you end up looking at the last 7 days, last 14 days, and last 30 days simply because there’s no other way to quickly filter down different time periods.
Gorilla ROI pre-calculated all the different time presets so you can know how much you sold today already.
So depending on the size of your account, if you have million-dollar sellers on the account, it’s still loads within a few seconds. And especially if you have like 1000, 2000 SKU’s, it may take a little bit longer.
You can always look at the last 90 days and change a time period. And this way you can pretty much understand how your product and how your business has been performing as well as how you can expect it to perform based on easily being able to project. Like if you look at last year, let’s say you sold like close to 9,500 and then this year, so far you’ve done 4,900.
Based on this, you can pretty much assume that this product will sell about a little bit more than last year, but about the same, and so you can do projections. You can get better accurate inventory projections when you order so that you don’t go out of stock. And you can also make it easier for like peak seasons and off-peak seasons and knowing when.
And again, these is just some of the things that you can do. There’s so much more things that you can do. It’s all about your creativity.
If you’re already doing 6 figures and you have lots of different products, you probably have your own dashboard so you can just feed the data straight into it. So rather than doing updating it manually, you can pretty much update everything automatically.
Filtering reviews
Gorilla ROI also has ways to pull in reviews so that way you can filter down and really look up reviews, get the direct links, etc.
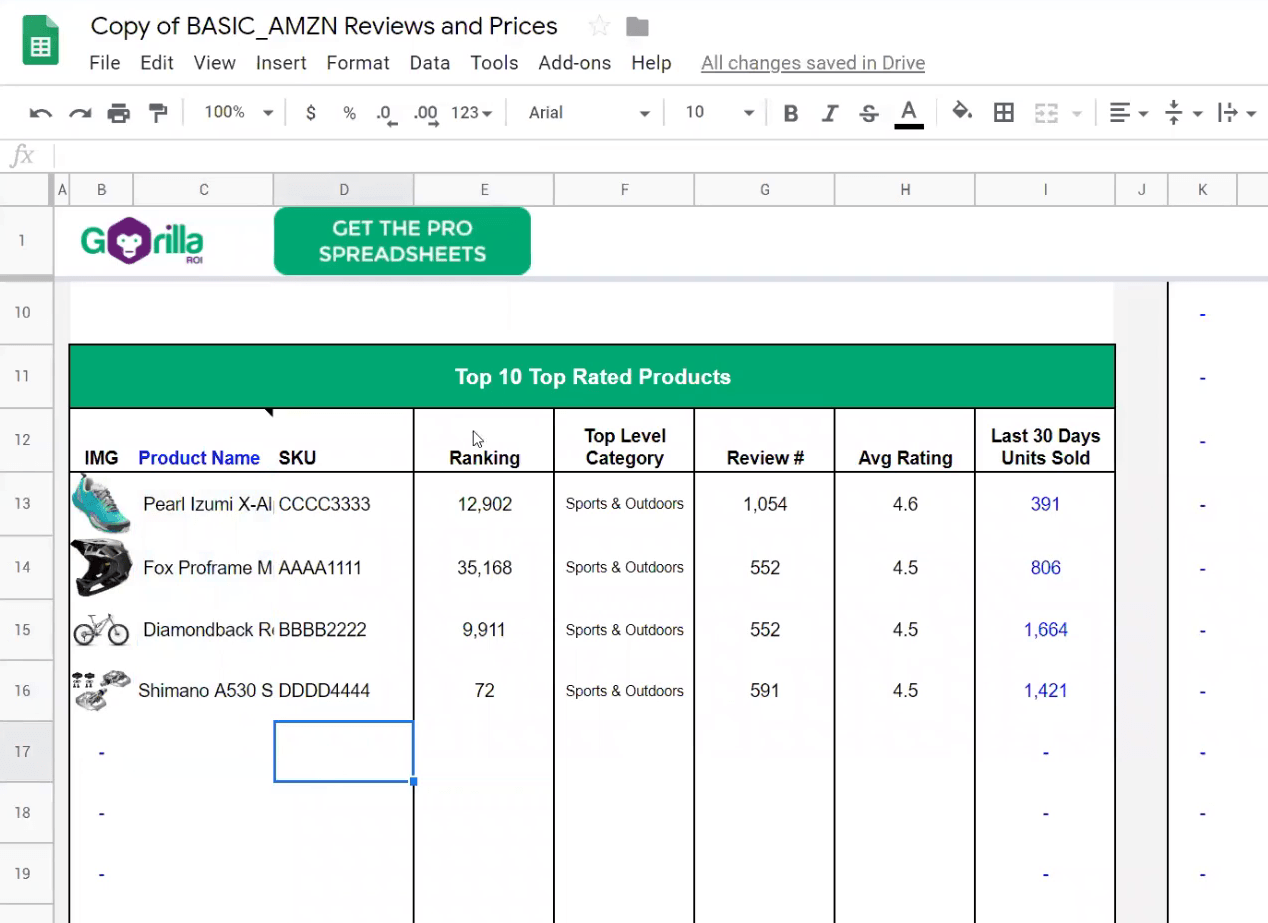
Get a quick idea of what your top 10 rated products are, based on the rating, all of this information can be pulled automatically from Gorilla with those custom formulas:
And so again, it’s the same type of format. So if you speak the spreadsheet language, if you think spreadsheets and everything else, is like your first given language, then this is going to be perfect for you.
Tracking hijackers
And lastly, the final template that we want to show is this one for tracking hijackers.
So here we have the title that was entered into Amazon and that automatically pulls it here.
Like I’ve got this Fox Proframe MIPS bike, that we’ve used in Amazon. And so what you do is paste the value in. Let’s say today is like January 1th, 2020, and you know that this is the title you updated. And for whatever reason, if a listing gets hijacked, then the first thing that hijackers will do is try to change your title or your image.
And so if for any reason this title does not match with your old title, then you know there’s something wrong with the listing. If your image all of a sudden gets changed, then again, you know that it’s been hijacked. So this has actually helped sellers on many occasions where they were able to detect hijackers within 10 minutes of it happening and got straight onto kicking them off.
How to get started
Since this is just based on Google sheets, one definitely has to have a Google account. Also, have to use Google sheets. But you can use it on any browser.
So if you use it on Safari, Chrome, Firefox, Internet Explorer, it works since it’s just loading within Google sheets. So if you go into the Menu – Add-ons, then that’s pretty much all you need.
The rest is just really just Excel or Spreadsheet formulas and lots of people have just been able to jumpstart it right away even if they were fairly new to spreadsheets. It’s because Gorilla ROI has templates that are easy to set up and have some really great videos and tutorials. So there hasn’t really been that many issues with people actually getting it going.
There are multiple templates. There’s a basic version where it’s just a very simple version to get you started and so everybody gets access to that no matter what plan you sign up for, everybody gets access. Also on their website, they also have a lot of these templates available for free so you don’t have to sign up for anything.
However, in some of those, because if you don’t have an account, you just have to update some things manually, but it’s easy to just get started right away.
Pricing
There are 2 types of accounts that you can get. One is for regular sellers and the second type is for agencies and people with a lot of different accounts. So the easiest one is for the single seller
Anybody can get started for free, it’s unlimited for any 3 SKUs that you have. So if all you have is 3 or less SKUs, then you can pretty much use this service completely for free.

And then this another one for people who have 3 or more accounts. So that’s a difference. So for the pricing, if you just have 1 or 2 accounts and less than 3000 orders a month, then you’re going to be on the Starter plan.
From 3-10K, you’re going to be on the Pro Seller account. And if you do a lot of sales and unlimited orders, then you choose Unlimited plan.
There’s an overage charge. If you start with less and then all of a sudden you did a million sales, then you’re going to get charged for those extra orders at 1 cent per order because of all the extra processing.
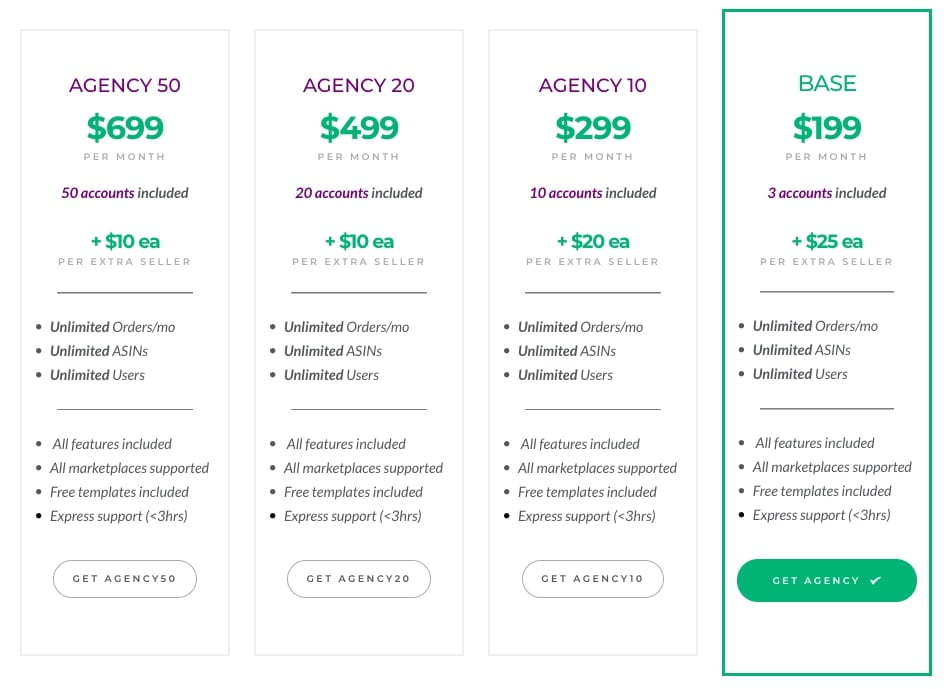
For any extra accounts that you want to add, it’s additional flats, $25 USD. And you can get all that by just going to the Gorilla ROI website and click on the actual product. And then you can see the pricing information. But for 9 out of 10 people, this is the pricing that will match what you’re looking for.
And here’s the pricing that Gorilla ROI offers for managing multiple seller accounts and marketplaces: