DataHawk is an Amazon Analytics Tool that helps professional sellers and vendors (1) track keywords and products rankings and performance, (2) run product research, (3) analyze market and competition data, and (4) run SEO listings optimization.
DataHawk is presented by the co-founder Othmane.
List of features covered in this video:
00:29 What is DataHawk and what problems does it solve for Amazon sellers?
01:27 What kind of users do you target?
02:31 Can private label sellers as well as online arbitrage use DataHawk?
02:54 Marketplaces that are covered at the moment
03:30 Dashboard overview
04:20 What is the function of Product Tracker tool?
06:57 BSR tracker overview
07:55 How to use keyword tracker tool?
10:11 What is Keyword Generator?
11:11 How can Onpage Seo tool analyze the product description?
13:05 Actions Log overview
20:22 Median rating & median number of reviews overview
25:55 Explanation of scoring and number of levels present
27:45 How to add a keyword
34:16 What does Average and Median mean?
37:35 Graphs overview and how to understand it
39:54 Types of Export
41:15 How can Product Research tool help new sellers?
46:32 Pricing overview
47:41 Are there any plans to integrate seller central?
48:36 What are the new features that DataHawk planning to release to users?
49:55 How can we contact the support of DataHawk?
51:22 Offer: coupon code DEMOMONDAYS to get 25% off up to 4 months of subscription
Transcript – Walk-through of DataHawk
[00:00] Augustas: Welcome back to another session of Demo Mondays. Demo Mondays is video series published on Mondays, where I invite creators and founders of different Amazon seller softwares, and I ask them to present their products just like this on the screen.
[00:14] Augustas: And today my guest is DataHawk.
[00:23] Augustas: DataHawk is presented by the co-founder Othmane.
[00:25] Augustas: Hello Othmane.
[00:26] Othmane: Hi Augustas, thanks for having me.
[00:29] Augustas: Nice to meet you here. So please tell us what DataHawk is, and what problems do you solve for Amazon sellers?
[00:37] Othmane: Yes absolutely. So DataHawk is an Amazon analytics tool for Amazon sellers, vendors, brands and consultants. And what we do is that we help them solve 3 main problems. The first one is helping them with product sourcing, so helping them figure out what product to sell. The second one is helping them understand the market in which they are selling. So understanding their competition, going really deep there, understanding how they should be pricing their products and so on. And the third component that’s most important to us, and that’s been our focus so far, is helping them with tracking the performance of their products. So that encompasses things such as tracking the best sellers rank, the keyword rankings and other metrics for their products and for the competition as well.
[01:27] Augustas: No, that’s great. And you mentioned that you are targeting also consultants, agencies and vendors. So can you talk more about target users of your software?
[01:39] Othmane: Yes absolutely. So I think the spectrum is very broad. We have customers that aren’t selling yet, that are contemplating starting setting on Amazon through Fba, and as you know, there are more than 2 million sellers, so it’s really a very big market. And then on the other very end of the spectrum, we have some of our customers, our top 50 global Amazon sellers that are making net worth of 50 million in revenues a year. So I think it’s a really broad customer base. On the consultancy side, we have some agencies for instance, that work for a global brands and those are people who manage different accounts, and they use our tool. We also have a private equity firms. So it’s really a broad spectrum of customers.
[02:31] Augustas: And basically also private label sellers as well as online arbitrage sellers can use it, right?
[02:40] Othmane: Yes. It’s both, it’s sellers and people who have their own brand registered in the brand registry program and so on. And it’s vendors as well. So no limits for who can be using the tool.
[02:54] Augustas: And very important information for international sellers. What marketplaces are you covering at the moment?
[03:00] Othmane: Yes great question. So we cover all Amazon marketplaces worldwide, except for China and Japan, which means that we are in the US, Mexico and Brazil, in all European markets, in India and in Australia.
[03:15] Augustas: Quite keeping up with the Amazon marketplaces everywhere, and I think we’re ready to check your tool from inside. How does it look and how does it work? So let’s do it.
[03:31] Othmane: Alright, with regards to how the tool works, one of the key things that we tried to do is making it easy for our users to organize the way they work, and we do that through one feature that we call projects, and here as you can see, as I login in my account, I can find the list of projects that I have created. And so project is basically a way for you to organize the way you work in DataHawk. It can be a specific brand, for instance, that you’re selling, it can be a product category, and each project is tied to our market place. So for instance, here Kanzek is a brand that’s focused around leather goods and you can see that I’ve created here a project around that’s focused on the United States. So let me dive into the first feature that I told you about, which is our product tracker, so now I’m looking at the dashboard of this project that I’ve just shown you, and here what you can see is a list of the major product metric changes that have occurred in the past 24 hours, and in the past 7 days.

[04:51] Othmane: So for instance amongst the products that I’m tracking, you can see that this one has had a huge raise in it’s best sellers ranking, it went from a 187k to 30 in one day. You can see changes in price and in reviews and so on. And if you wish, you can go into more details and compare the major changes that have occurred in two specific dates. So moving onto actually the core of how this works. It works in two main ways. So first you need to track products that you are interested in tracking, obviously. So as I move on to this page here called products that you see, you can see a list of all the products that I’m tracking. So here, there are around 226 products that I’m tracking in this project. You can actually filter through them by price, rating, number of reviews, or even by entering the name, I mean a keyword in the title or the seller name or any other.
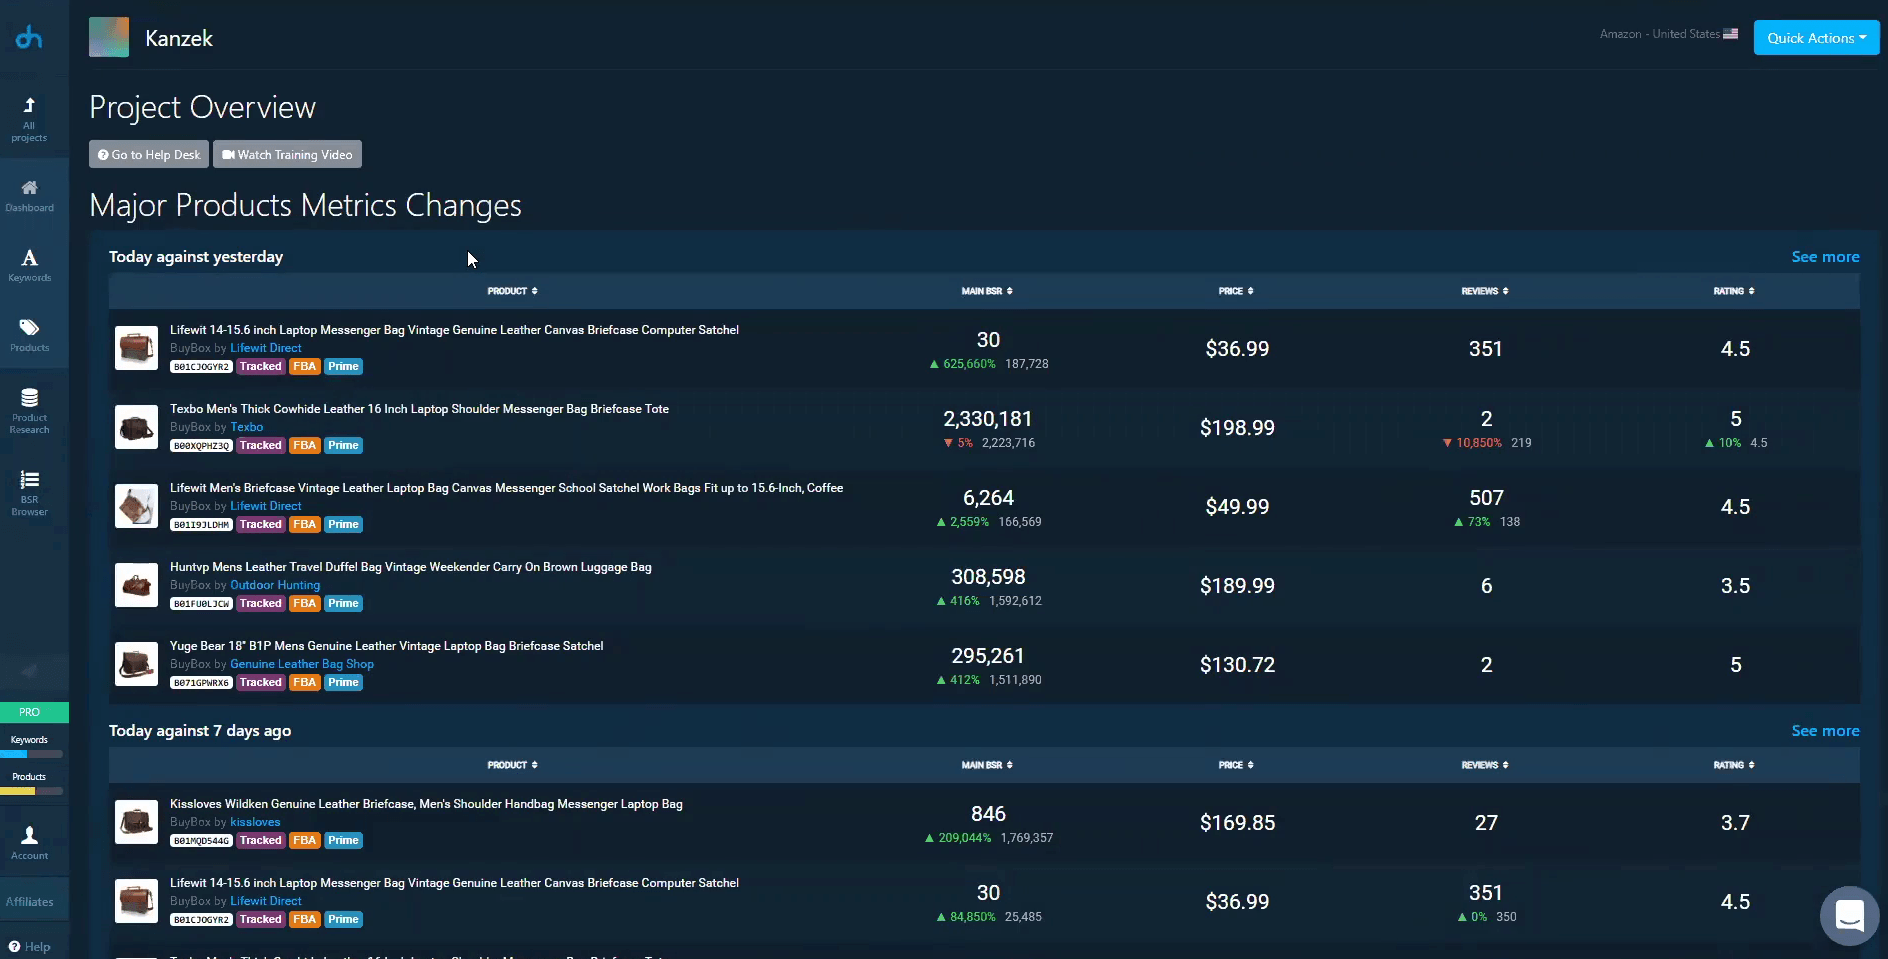
[05:58] Othmane: We also give some high level information here, such as the number of sellers that are competing in the buy box for each product. It’s price, rating, number of reviews, current BSR, it’s estimated sales figures in dollar terms and in term of units. It’s related fees as well, and the margin you can expect from each product. Other high level information you see here is who’s winning the buy box. You can see that this is an Fba product, so it’s prime. This is the way it’s presented. Now let’s say that for instance, you’re interested in diving into more details in these products from the brand called Polare. So it’s a full grain leather messenger bag, once you click there, what you can see is a nice interface in which we present the history in product metrics related to this product.
[06:57] Othmane: So you can see changes in it’s number of reviews over time, as you can see it has been increasing by 4% since last week. We can see the change in it’s rating, bestseller rank, buy box price, what we call, buy box available quantity, which is basically the quantity you can pick when you want to buy a product. And arranged regarding the estimated monthly sales velocity for each product. Now if you want to dive into more details, you can move onto the second tab here called BSR tracker. And here you can see in more details how the BSR has been changing, and actually it’s not showing up in this product specifically, but we can track up to 4 BSR categories here. So it gets interesting if you want to see how you’re doing. For instance, in the briefcase category as compared to the global apparel and clothing category.
[07:55] Othmane: Moving onto the third tab called keyword tracker here. Basically what you can see is the changes in the keyword rankings related to this product. And the way we do that, and this is super important to emphasize on DataHawk, you don’t need to tie a specific product to specific keywords. We do that manually. What I mean by that is that the keywords that are showing up here, for instance, 66, you see 66 indexing keywords. So those are all the keywords that have tracked within my project. And which our tool has automatically found to be ranking for this product, so what you can see here is a clear history of how it’s been doing over time. So you can see that for 17 inch leather briefcase, for instance, as of the 25th of September, it’s ranked in page one, position one, you can see the monthly search volume related to each keyword.
[09:02] Othmane: You can see the 7 days average, 7 days change and so on, with some awesome color signals here that you can see, which helps you figure out overall trends. So the greener, the better. Green means page 1, red means page 9. And what’s interesting actually for every seller I assume, is when you go to those metrics and you can see that all of a sudden you went from page 6 position 235, to page 1 position 16 for this keyword. And what this can help our sellers, is tell them that probably they’ve had a sell that came from this keyword. Or probably they’ve done a change in the backend interface in the keywords that they’re using, which made them rank better for this product. And here you can get on my chart as well that helps you show the rankings that you have here on the table, but show them as a chart so as you can see, I can pick the ones that I’m most interested in seeing, and it’s pretty cool because it helps with getting overall trends.
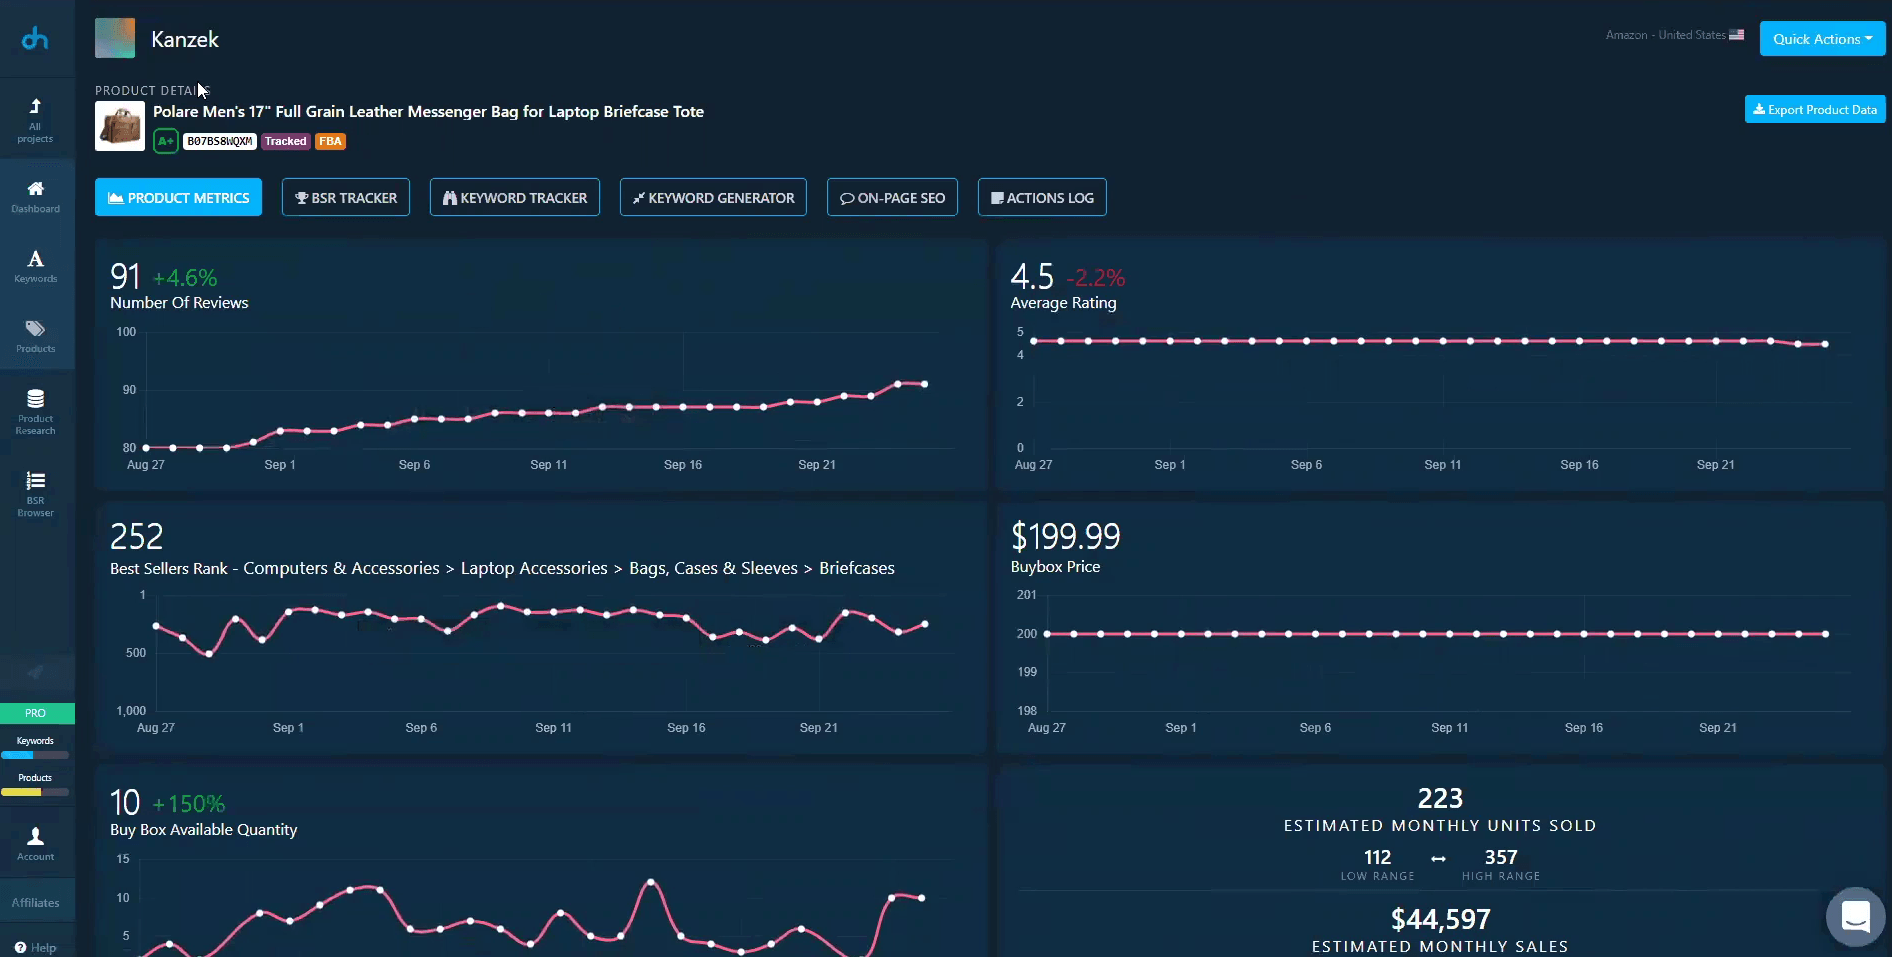
[10:11] Othmane: Now the fourth thing that we give with regards to product, is a Keyword Generator. And our Keyword Generator is a tool that looks, that runs a semantic analysis on the description of the product. It’s title, bullet points and other competing products, and figures out a list of related keywords that you could use either to improve your SEO performance for that product or to use for your PPC campaigns, and so on. So this one for instance, and as a reminder, it’s a full grain leather messenger bag. So our engine figured out that a related keyword could be cross body leather bags for women. For instance, our leather bag, leather bags are leather bag Satchel and so on, so you can see what it’s related to. You can see the best department that it’s related to. So for instance, for this one we suggested home and kitchen.
[11:11] Othmane: So you know that it’s not relevant one, for this one, you can see it’s related to handbags, it’s a better suggestion. You can also filter by search volume, and by estimated CPC. Now should you be more interested in digging deeper into any keyword of those. You could track it and I’ll show you later on what kind of information you can get when you’re tracking keyword. Now moving onto the fifth tab called Onpage Seo. What this is, it is a tool that looks at the product description and analyzes it. So which you can see here is a cloud of the most used words in this product description. So for instance, leather has been used 6 times in it’s description. We can see the number of characters in its title, the number of words and so on. You can see also something super interesting here, is change history.
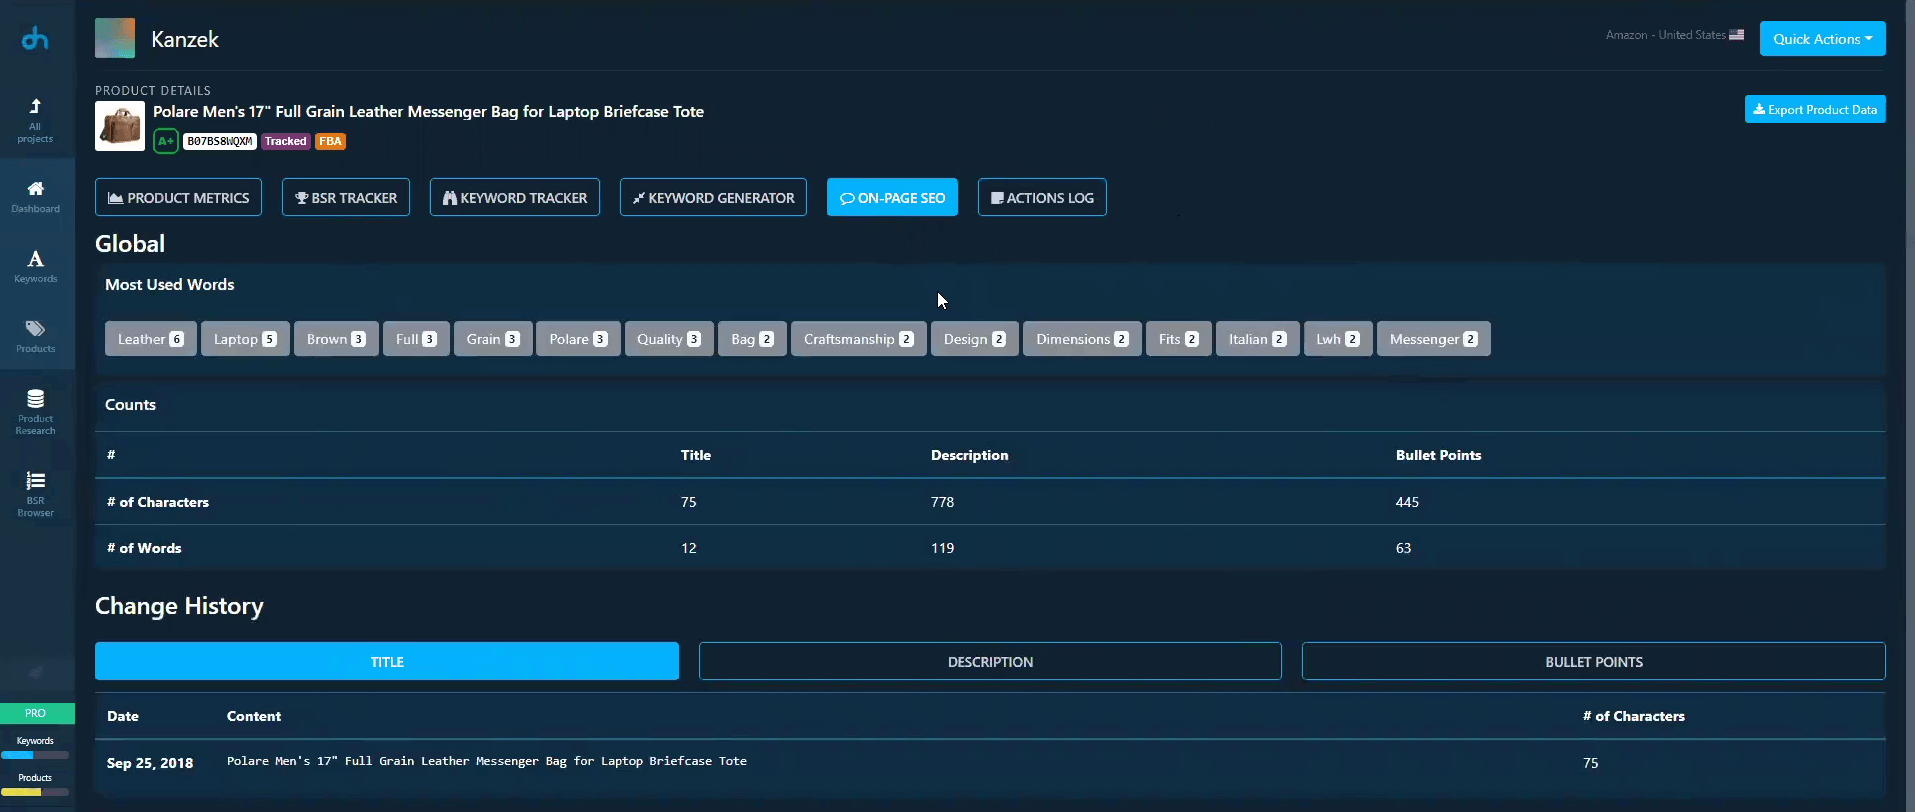
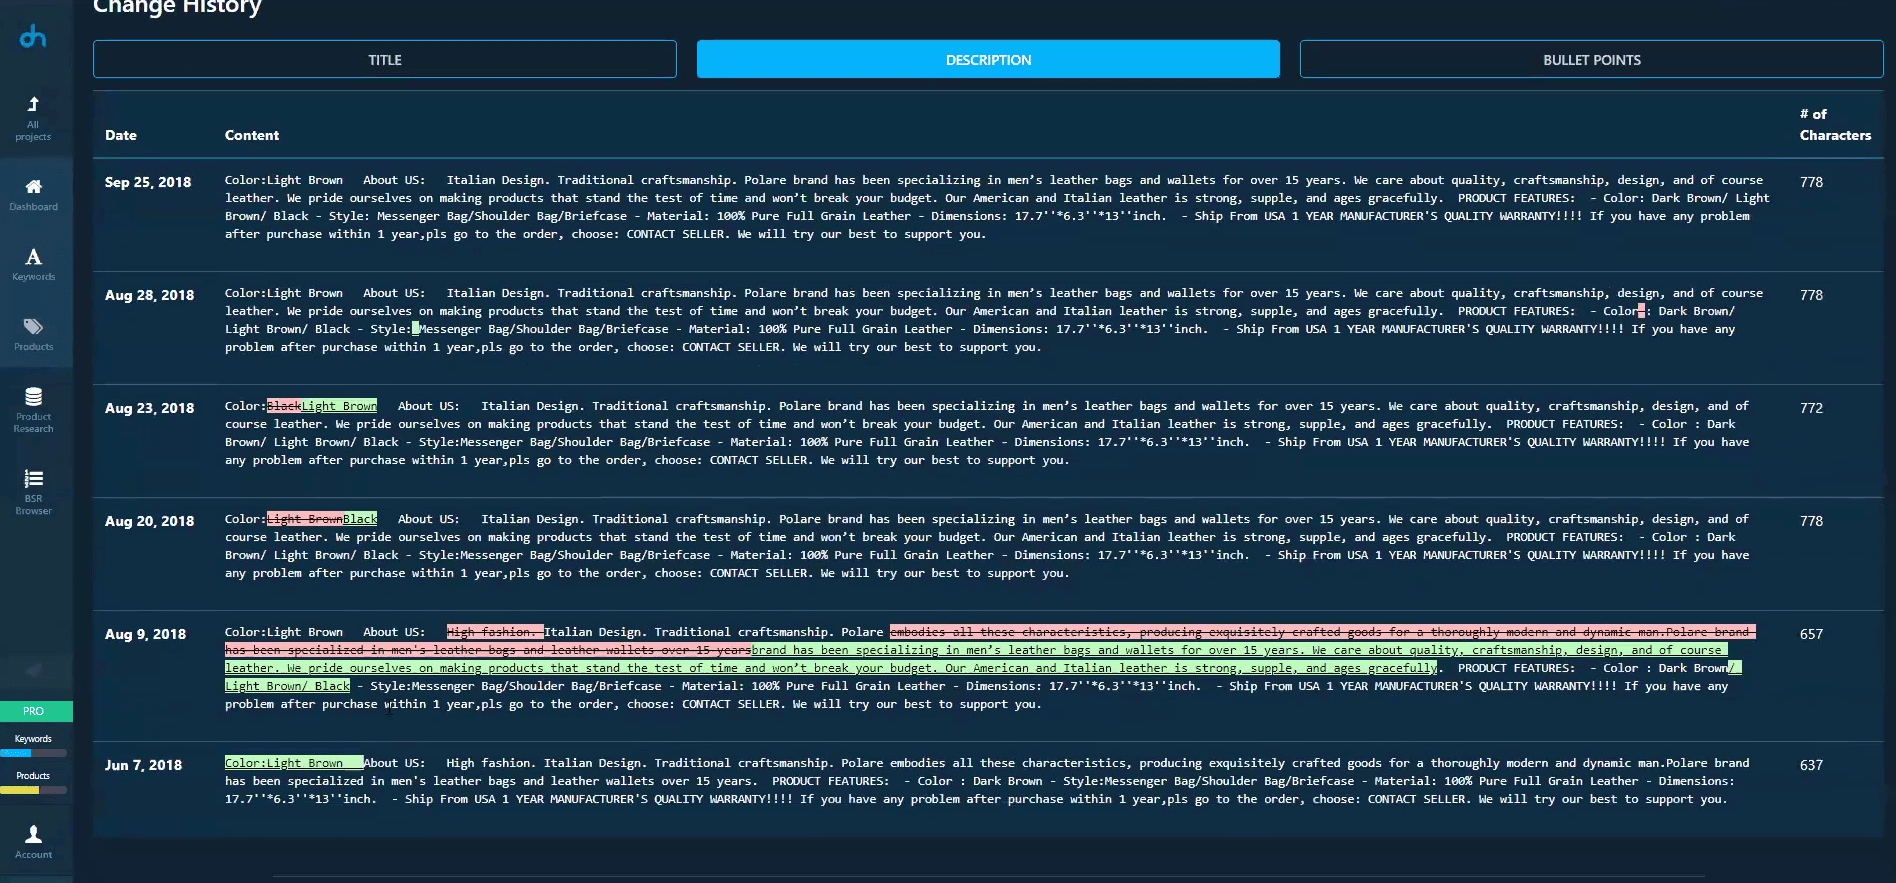
[12:09] Othmane: So for instance, this is the title that the product has as of the 25th of September. Now if the seller were to change the product title at some point in time, we would track this here and show you the change that occurred, and we do the same for the description. And here it is super helpful here. For instance, as you can see on the 9th of August, there’s been some changes here and we show you in green and red what’s been missed what’s been added and so on. So that can be super helpful.
[12:46] Augustas: And this information can be tracked for any kind of ASIN and also competitor ASIN ?
[12:52] Othmane: Absolutely. So this is really open, so far as I’ve shown you, we don’t connect to the seller account at all. This is all done by our technology without connecting to the seller account.
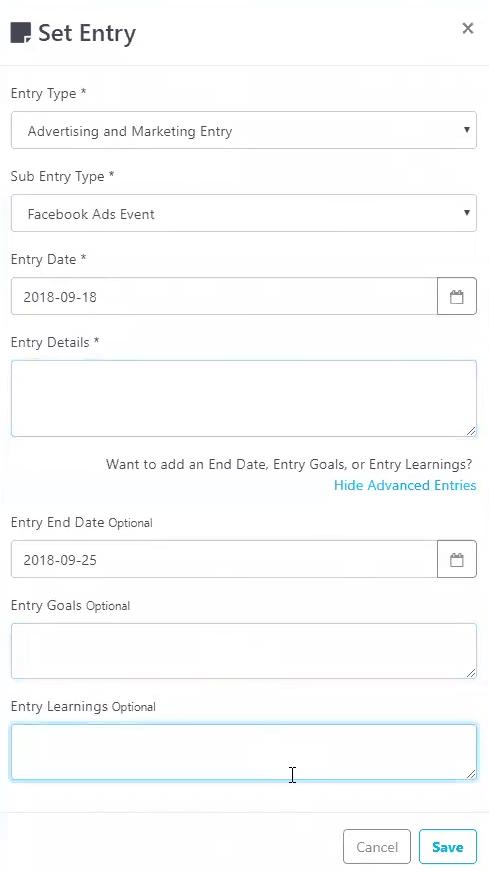
[13:05] Othmane: So you can do this for your computers. Absolutely. And I think this is where our tool comes most handy. It’s basically helping you with not only tracking your own products performance, but helping you benchmarking your performance against that of your competitors. And now the very last tab here called actions log is one that’s super interesting for other data driven people that want to attract, let’s say, what is the effect of their daily actions have on the performance that they have. So for instance, Augustus assume that you are selling this product, and that you run an advertisement campaign on Facebook for instance. Now what most people do is that they just forget about this and don’t draw correlations between what they do outside of Amazon, and the impact this has been on Amazon. So by using our actions log, you can add entries where you can tell that for instance, you’ve run an advertising and marketing action on Facebook for instance, and you start a date on the 18th of September, maybe and finish date on the 25th, right?
[14:22] Othmane: So you can add any details you want about it. You can add the goals that you have on mind, you can add the learnings that you’ve had extracted afterwards and so on. And hit save. And once you do that, it’s going to appear here. So when you figure out, for instance, a huge change in your BSR, any of other performance that you have, you can go back to your actions log and try to figure out what it is that you’ve done that helps you reach this new performance. Now the other thing that’s interesting is that, we value the importance of data ownership. So which is why the, the other interesting thing that we decided to do is allow our users to export their data to Excel and play around with it. Because for instance, you want to draw correlations between the sales you’re doing, and the impact they’re having on your SEO performance or your BSR, and so on.
[15:20] Othmane: So you can export your product data to Excel as you can see, and get a very nice report on Excel where you can see here it’s a printable, printer ready report that you can see with an overall view of the rankings that you’ve had. So for instance, for one product that I’m showing you here, at some specific point in time, it had 66 keywords for which it has ranked, but now it’s only ranking for 21 keywords so you can know that there’s something that maybe has occurred in between and that prompted this change. You can get a high level view of other keywords, performance and so on, the top 10 keywords, for instance. Here, you can go into much more details in the second tab called keyword ranking. So you get basically what you get in the APP here in the keyword tracker tab, but in much more detail.
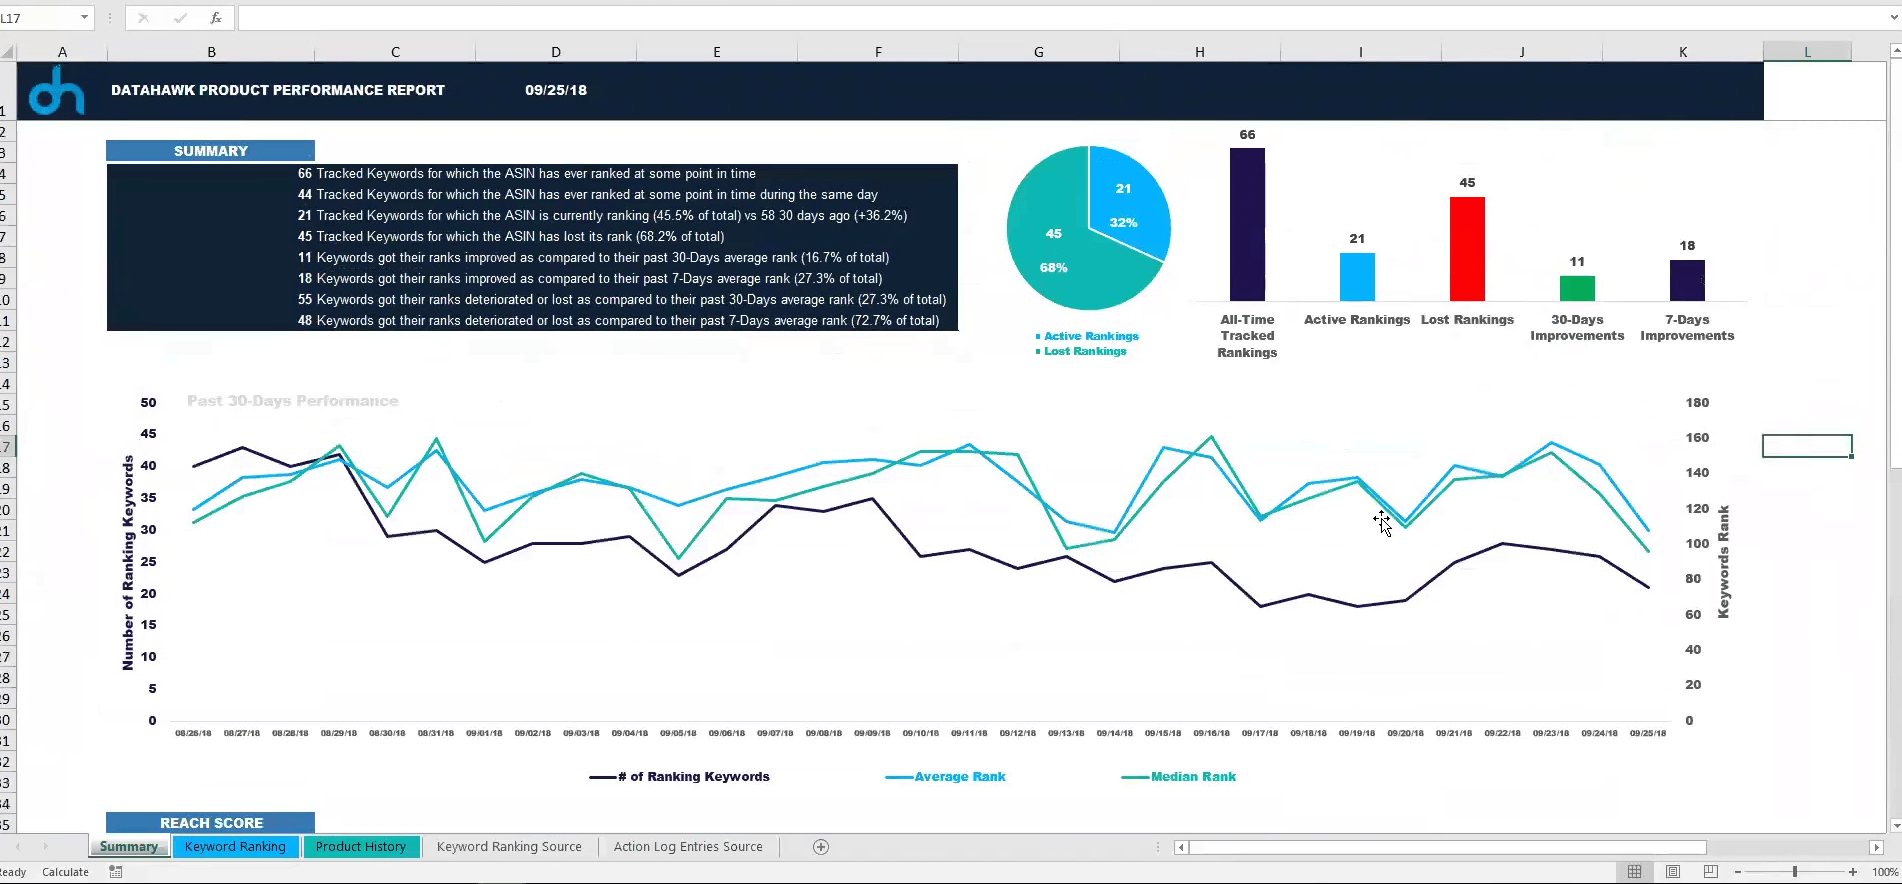
[16:24] Othmane: So for instance, let’s take this keyword, 15 inch leather briefcase, and I’m going to highlight it in yellow so you can know that currently the product that I’m showing you here, isn’t ranking for this keyword, but interestingly it’s been ranking for it on the 29th of June actually. And the rank it had at the time was 64. And that’s the best ranking actually it had for it. So what this helps you to do is go to the 29th of June and try to understand what it is that you were doing back then that made it possible for you to rank for these keywords. So that could be, for instance, running PPC campaigns focused on this keyword or maybe having a lower sale point or maybe a higher sales velocity and so on. And this is the kind of really super helpful data that we’re trying to give to our users. And you can also track other changes here such as changing its price rating, answered questions, estimated monthly sales who was holding the buy box and so on.

[17:40] Othmane: Is there any question you have on this so far?
[17:43] Augustas: Yes. On the BSR tracker, I see it was an information about the last 30 days, is it possible to change to any period?
[17:53] Othmane: So here on the APP we showed the 7 days average, and of course on top of that you can see it on a daily basis. And naturally when you export that to Excel, you can pick whichever date you want. So because here you have for each date, you have the corresponding VSR that you see here, and you can see the categories related to it. So if you want, you can pick whichever average that you want. Now moving onto the second component that’s super important in our tracker tool, the keywords component, as you recall, I’ve shown you how this product is ranking for a certain number of keywords.
[18:37] Othmane: But what I haven’t shown you is what our tool looks like on the keyword side, right? So moving onto the keywords side. What you can see here is a list of all the keywords that I’m tracking within this project. So stuff such as leather strap replacement, small leather briefcase, modern briefcase and so on. As you recall, this is a project that I made, around the specific brand that selling leather goods. So what I decided to do, is organize everything in such a way, that this is about leather goods. Another way you could have done it, is create a project maybe for leather portfolios, another one for leather messenger bags and so on. And be really more precise about this. So in any case, this is the list of keywords that I’m tracking within my project. So 194, you can get some high level information about the number of products that are ranking for each keyword.
[19:35] Othmane: And what I mean by number of products that are ranking for which keyword, I mean the ones that appear on the browsable search results on Amazon. So if you were to type small leather briefcase on Amazon, there’s going to be a specific number of pages that you can browse through. Usually it’s between 7 to 20, but 20 is usually the maximum. And on average is going to be around 20 products per page depending on the layout that you get. And so here we show you the number of products that are ranking in those browsable search pages. And you can see the median price related to each keyword, or I mean by that is on average, if you look at all the products that are ranking for each keyword, what’s their median price, and this is an answer that we can give and we give it in much more details, I’ll show you how
[20:22] Othmane: We also give median rating here, the median number of reviews and the search volume related to each keyword. Now the search volume is a data that we fetch from Google and we think it’s a very good proxy in telling you what that would look like on Amazon. One metric I didn’t talk about that we have in the product side, but as well as on the keywords side is the score that you see here. And this score is basically an attempt from us to try to go to which degree within a keyword to be competitive or a product to be competitive. So for instance, we deemed the small letter briefcase keyword to be super competitive. Why? The reason is the number of reviews that the products that are ranking for it have, it’s probably a super high number of reviews.
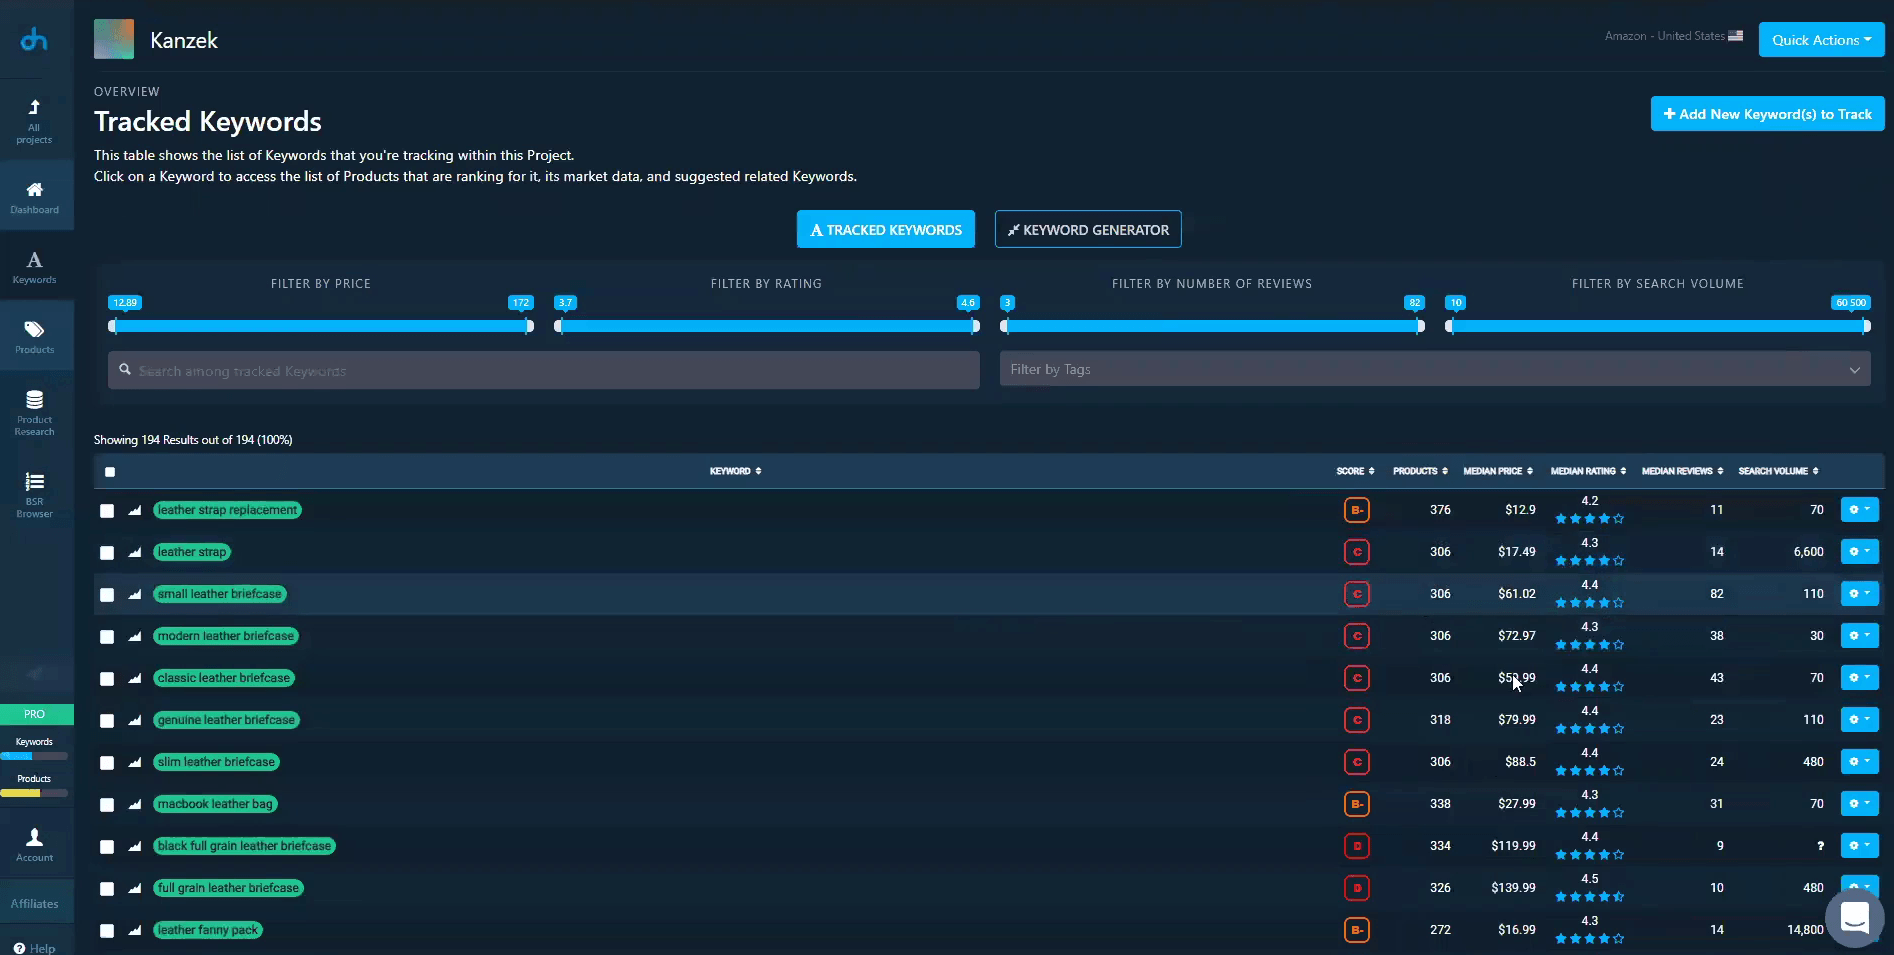
[21:14] Othmane: So it’s going to be hard for you to penetrate that market, and also the rating, on average those products that are ranking for it, have really good ratings, so you need to really be killing it in terms of product quality to rank there. So again, you can filter by price rating, number of reviews, search volume, and so on across all the keywords that you have here. One thing that I didn’t mention is that you can filter by tags, and tags are a cool thing that we built to allow you to go deeper in how you organize your project, because you are able to assign labels or tags to each of those keywords. So for instance, let’s say that I want to show only the keywords that I’m tracking that are related to portfolios. So here they are, I’ve tagged them with the portfolio label, I have actually even tagged some with 15 inch for instance, or with stuff such as low volume, low competition and so on.
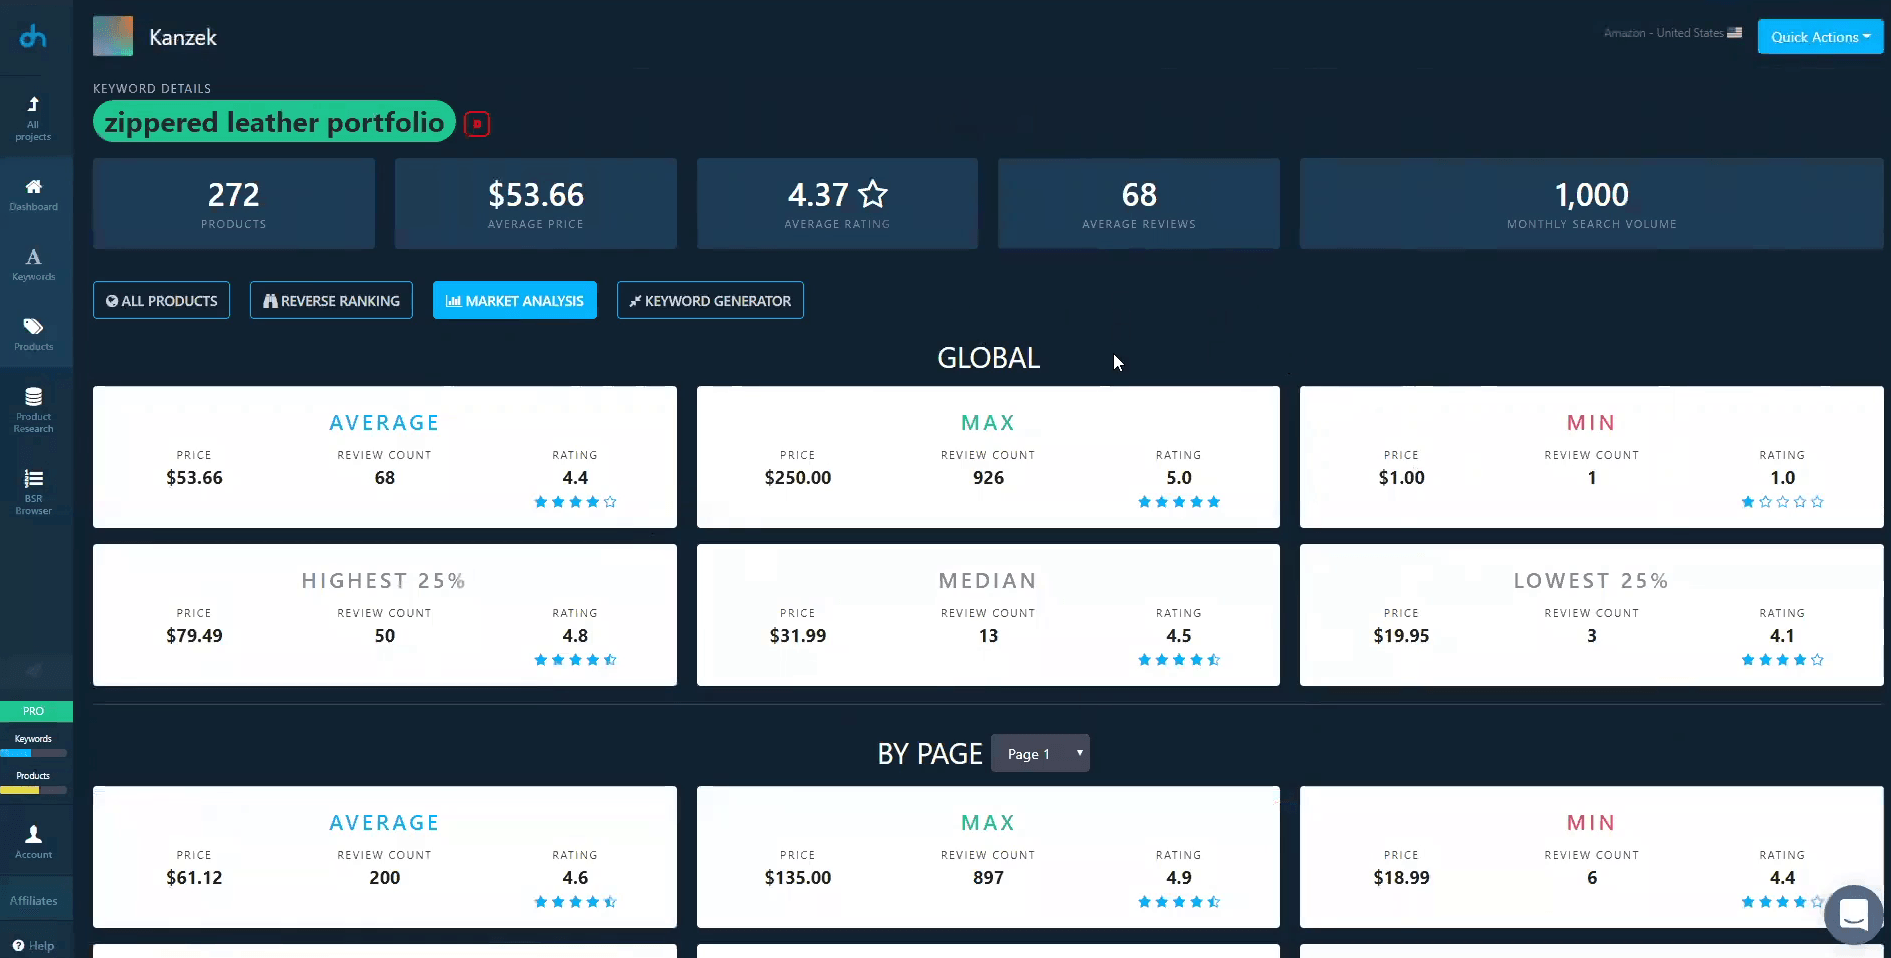
[22:17] Othmane: The way you can do that is pretty simple. You Click on the dropdown manage tags and you can pick the text that you want. So that’s super helpful. Basically, in allowing you to get better organized using our tool. Now let’s say that you’re interested in maybe selling a zippered leather portfolio here. This is a super interesting keyword. Super High Volume, 1000 monthly search queries. It looks like a good one, although it’s super competitive. So as I clicked on the keyword, what you can see here is 4 main tabs, all products, reverse ranking, market analysis and keyword generator. Now on the first tab in which we’re currently at called all products, you can see the list of all the products that are ranking for this keyword if you were to type zippered leather portfolio on Amazon at the time at which we fetch this information.
[23:20] Othmane: So typically here, there are 272 products that are ranking for this keyword. You can see what those products are. Here you can see their ranks, so the little figure is the page, the larger one is the overall position. So this one is ranked page 1 position 1, page 1 position 2, and so on. Again, we give information about our scoring for the product, the number of sellers that are on the buy box, each rating, number of reviews, price, estimated monthly sales figure and estimated potential margin. And now whenever you see a question mark here, the reason is that the product isn’t tracked. So in order for us to unveil those metrics, there is a need for you to track each product, right? And for instance, those ones are actually being tracked so you can unveil the information, you see they have only one seller. So this is a private label brand for sure.
[24:17] Othmane: You can see their estimated monthly sales and so on. Now something that can be super helpful in terms of helping you with understanding your market. And it’s something I was saying early on during our call when I mentioned the kind of needs and problems that we solve. Now let’s suppose that you are launching a leather portfolio and that you were hesitating as to what kind of pricing you want to have and so on. Maybe you were going for a price above $100, so what you can do if your goal is actually to rank for zippered leather portfolio, is go here, filter the price to above $99, and what happens is that almost instantly we can show you what are the products that are ranking for these keywords, and that corresponds to the filtering criteria that you’ve selected here. So there are 45 results out of 270, around 17% of the product that are ranking for this keyword that are priced above $99.
[25:20] Othmane: Now what’s interesting is how they’re distributed across different pages and as you scroll down, you can see the detail ranking that each of those ones have. Now again, you can go much deeper. Maybe you want to see only those that have more than 30 reviews so you can filter by that as well. It shows you that only 1% of the products that are ranking for this keyword are priced above 99 and have more than 31 reviews. So again, that can get super interesting in helping you drive in your pricing strategy or product launch strategy and so on.
[25:55] Augustas: And Othmane, could you explain the scoring? How many levels do you have? I see there is from A to D, but A has plus, no plus and minus.
[26:08] Othmane: Yes, so for each letter we have 4 letters. So A through D, and for each letter you have 2 scores, you have minus and the normal letter. So A would be better than A- for instance. And A- will be better than B and so on. And for instance, if you look at this product, if you’re curious as to why it has A, it has a super great rating. It has 4.7, while interestingly, the average rating for the products that are ranking for this keyword is 4.37, so it’s much higher. It also has a very good review score. Of course it has a 107 reviews, so super great. The pricing though is not as good. It has a pricing score of only 51%. The reason is simply because it’s price, as you’ve seen, is much higher than that of the competition, on average, competing product here are priced at $53.66.
[27:11] Augustas: I thought I saw A+ score.
[27:16] Othmane: Yes, probably on the first page that we’ve seen, let me reset this, so A+ would be the top level, A+ then A, then A-, then B+, B, B- and so on, though it’s super rare to have A+ products, as you see most of those are really on page 1 and are killing it in terms of performance, 500 reviews, 900 reviews, as you can see, really good performance.
[27:45] Augustas: Alright. And how do you add a keyword?
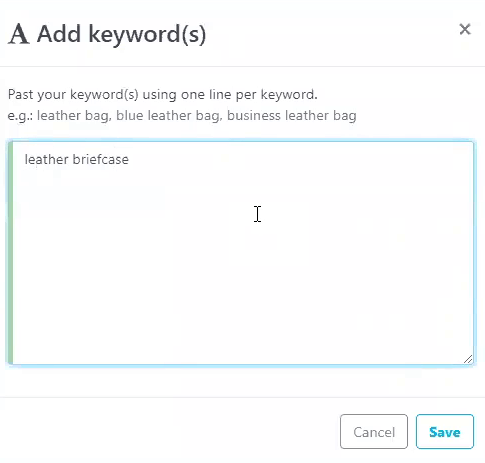
[27:50] Othmane: Super great question, so I haven’t been tackling that yet, but the way you add keywords or product, there are two ways of doing it. So either you go to the keyword section, for instance, that you see here, and you click on the button on the upper right side of your screen called add new keywords to track.
[28:08] Othmane: And as you click on it, you can enter the keywords that you are interested in. So leather briefcase for instance, and so on, so one keyword per line or using commas, and then he’d save. And what happens is that after a few seconds to a few minutes, the data related to each keyword will be fetched and you’d be able to rush through it, so the same for products. If you go to the product section, you click on add new products to track and then you just paste your ASINs here. Now one interesting thing that we do is, let’s assume that you’re selling a leather bag that has three different colors, black, blue, and Brown. Now you can either add each ASIN individually or you can enter only one child ASIN, or maybe the parent ASIN, and tick the box here, where you will decide to have us automatically track all associated ASINs, and then paste one of those and hit save.
[29:10] Othmane: And so what we would do as you do that, is that will basically go and fetch the data related to all the child ASINs and show it to you in the following way, so you have the parent ASIN that you can see here and you can see a label calling it parent, and underneath you can see the child ASINs. And one super cool feature that we have is that as you’re tracking your keyword performance, we show you actually whichever the child ASIN which you’re looking, we’re telling you which one is actually ranking for the keyword. So for instance, here you can see that for luxury leather messenger bag on the 21st of September, actually it wasn’t this variation that was ranking for this keyword, but it was another variation of the same parent ASIN.
[30:06] Othmane: And you can see it here and the difference is told through the color signals. When the background is filled, you can know that it’s this very same variation that’s ranking. When it’s not, you can know that it’s different variation. And the final way of doing it, of adding a keyword or ASIN is through the quick actions button that you can see here. So as you click on it, you can click on either add keywords to track, add products to track and basically do the same approach, whichever the place in which you browse in inside our app. So I’m going to go back to the example we were looking at. I think it was zippered leather portfolio here. So we’ve discussed the products that are ranking for it. Now, let’s assume that you want to have a less detailed analysis of the market, although it’s super detail and you’ll see how you can move on to the third tab here called market analysis, and get the following information.
[31:09] Othmane: So here, on a global basis, we tell you that for instance, all the 272 products that are ranking the browsable search results for this keyword on a median basis are priced at $31.99 On a median basis, they have 13 reviews. On an average basis, they have 68 reviews, and we go actually much deeper because at the end of the day, what’s important to you is ranking a page 1 , so we allow you to answer the same question on page by page level. So if you were to try to rank at page 1 , well you know that you probably want to have around 200 reviews. Otherwise your odds of being there are super low because on median basis, products that are ranking on page 1 for this keyword have 164 reviews. If you go to page 2, it is going to be easier, 5 reviews on average, not that hard, but page 1, super tough, and we tell you the same for pricing.
[32:11] Othmane: Let’s say that you wanted to price your product at $200. Well, by looking at this, you can see that this is our approach to cracking the A9 Amazon ranking algorithm. It’s true this kind of insights that we give you. You know here that for instance, if you are to price your product at $200, the odds of your ranking on page 1 are non existing, because the top price product on page 1 is priced at $135, and on average, the price is actually 61, so you can see that it’s super complicated. And here, if you want to see this information visually, we give you three matrixes in which you can see, for instance, here on the X axis, the price and on the Y axis, the position for this keyword. And so as you haunting at a specific price, so let’s say for instance, here you can see exactly which product it is, how much is the price, the position and so on.

[33:21] Othmane: And what’s interesting is the concentration that you see here. So let’s say that you want to see only those that are below position 50. Basically you would be looking below this line, and the concentration of the products that are below this line is rather here than here, despite a few exceptions, it’s more around here and actually the top ones are actually here, it’s around 30, so you can know that the sweet spot here if you want to rank at top positions is probably at this price point and now that can help you with product sourcing strategy or positioning and so on, depending on the kind of private label brand that you want to launch for instance, or the product that you want to be sending there. And again we give the same information for rating versus position, number of reviews versus positions.
[34:16] Augustas: One question, what does Average and Median mean? I mean for me it’s the same.
[34:23] Othmane: So the average would be just the mean. So you would take the average price of all the products, while the median would rather look at the distribution and how 50% of the products are actually below the price point, and 50% are underneath it. So for instance here 31.54 is the median price. So that tells you that 50% of the products are above 31.54, and 50% are underneath it. So it’s a better way for you to actually look at averages because if you look at just averages, of course data can be off because if you have a product that sending out 10 million for instance, while all the other ones are selling below 100 when it’s going to drive your average at insane levels, while if you look at the median, it will avoid you from getting into that analysis mistake.
[35:20] Augustas: So do you suggest to look more at the median block?
[35:24] Othmane: We suggest for people to look at both for sure, but then again, you have the global look here in which you can see the maximum price. So you can know if there’s anything off, if there are some sellers plane with the algorithm by pushing it through. I don’t know what kind of black hat techniques they might be using, but yes, I think it’s definitely helpful to look at both. And actually, as you can see, we give the minimum, the maximum, the top percentile, the lowest percentile, the median, and the average.
[35:55] Augustas: Yes, very interesting.
[35:58] Othmane: Now moving on to the two other tabs that we haven’t tapped on here. Again, we have a keyword generator that basically looks at all the products that are ranking for this keyword and suggests you a list of other keywords that you may be interested in that are related to it.
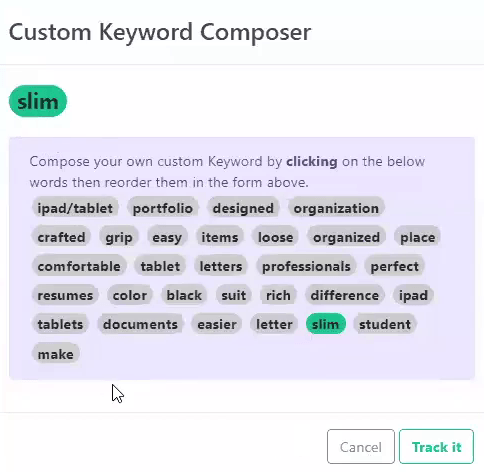
[36:15] Othmane: So for instance, zippered leather portfolio for man, zippered leather portfolio organizer, zipper leather padfolio, zippered leather binder and so on. So as you can see, it can be really super detailed, and the list is really super large. So it’s around 200, up to 250 keywords I think. And again, you can track the ones you are interested in. You can also add new keywords from here, if you’ve had an idea, for instance, then you just enter it here and hit save. You can also compose your own keywords based on a few words that we show you here. So for instance, maybe slim, Ipad/tablet, portfolio, and then click on track it and we’ll start tracking it. And finally the other tab here called reverse ranking, basically it just shows you the products that you are tracking within your project, and how they’re ranked for this keyword in a very summarized way, so that can be super helpful to you as well if you’re curious as to how they are doing. So for instance, for this one you can see how it’s been doing and you can decide on, you can look at that for any products that you’re currently tracking.
[37:34] Othmane: Any questions?
[37:35] Augustas: Yes. In the last graph views, it revealed that there was a gap. Why is that?
[37:43] Othmane: Yes, great question. That happens very often. So essentially what it means is that the product has fallen out of the rankings. So it was ranked at position 17 here, then position 14. So essentially a lot of possibilities there, either for instance the product went out of inventory, and so if it went out of stock, it wouldn’t be showing in the search results, or for instance, it’s been closed by Amazon temporarily, so anything related to that basically has had a sudden maybe raise in the ranks, and then it fell out of ranks or maybe the seller has stopped using a keyword that really helped with driving the ranking stairs, so he took it off from the title or from the description and so on, so it really depends, but usually it’s related to the inventory.
[38:47] Augustas: And this graph was dropping. There was an animation, is it just an animation or it is also showing us some information?
[38:55] Othmane: No, it’s an animation, it is basically as you click on the dropdown, it loads up.
[38:59] Augustas: Okay.
[39:03] Othmane: Alright. I think with that we’ve covered all the aspects related to our tracker. And again, there are a lot of information here that you can export to Excel. I’ve shown you only one, but here a second one for instance, would be this, this is for instance, the export of keywords of the results related to a keyword, leather strap. You can see all the products that I’ve shown you in the product step here. So we have lots of exports. We also allow our larger sellers to use our API, so some of them are very sophisticated and want to use more advanced tools to fetch the data from us. So we have an API that basically allows them to do this as well.
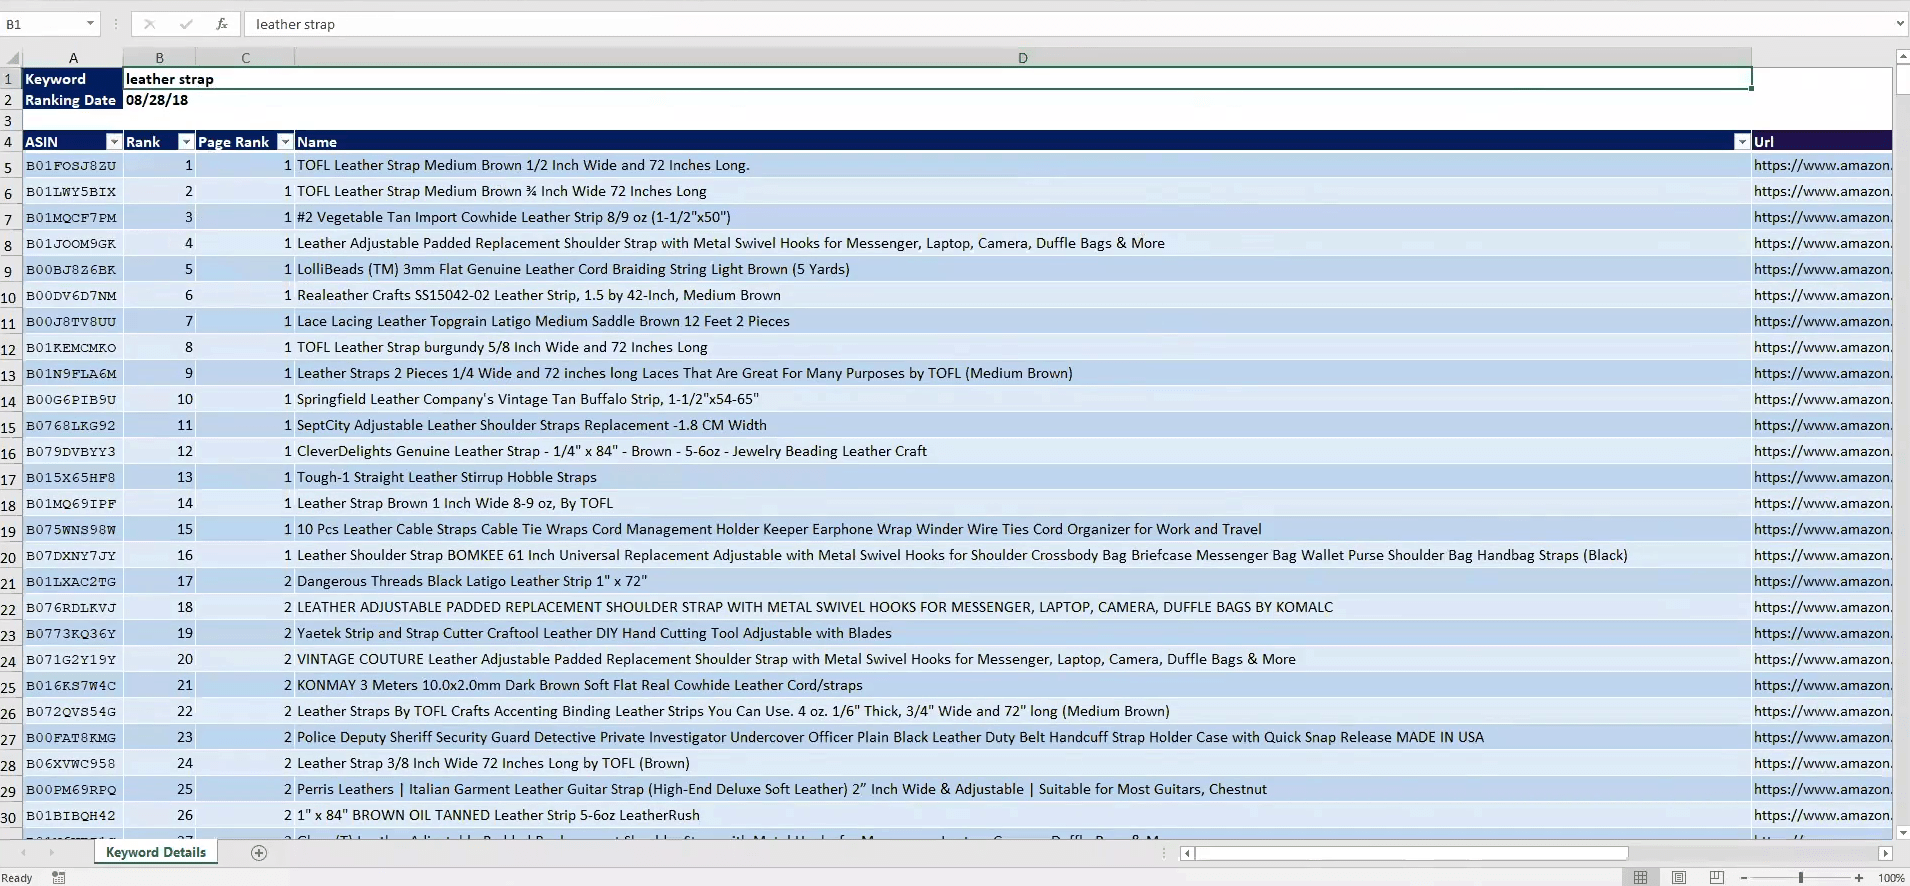
[39:53] Augustas: And how do you export?
[39:54] Othmane: So you have three or four different types of exports, the first one is the product export. So when you’re looking at a product, you can click on here, the bottom here, export product data, and you will get one of the exports that I’ve shown you, which is this one. That’s super detailed around the product. The second export that you have is the project export. Now with the project exports, you basically export all the data related to all the keywords and all the products that are in your project within a single CSV file, so you can do it from the quick actions menu that you see here by clicking on export project data, and the other export that you have is on the keywords. So for instance, let’s say that you’re looking at the leather strap keyword here on the results that you get from the products that are ranking for it.
[40:58] Othmane: You can click on this little text here, export list and you’ll get the list of all those keywords. So different ways of doing it. If you want your whole account export, we do have that as well. If you have one, just a project export, we have it as well if you want the keyword or the product.
[41:15] Augustas: Perfect, thank you.
[41:15] Othmane: So I think that we’ve covered the tracker aspect of our software, now the last two components are focused towards new sellers and upcoming sellers that are in the product sourcing phase. And we helped them through two ways. So the first one is a little tool called the Product Research tool here that you can see, which allows them to browse through our database of currently around 3.5 million products and is growing a lot daily, and we do that in a very simplistic way as I’ll show you. So here you can pick across different Amazon browse nodes or categories. So for instance, let’s say that you want to launch, maybe something in the clothing category, priced at between $29 and $34, and maybe you want to see only the products that are in the clothing shoes and jewelry category of price between $29 and $34, but that had between 100 and 150 reviews. And maybe a rating above 4.5.
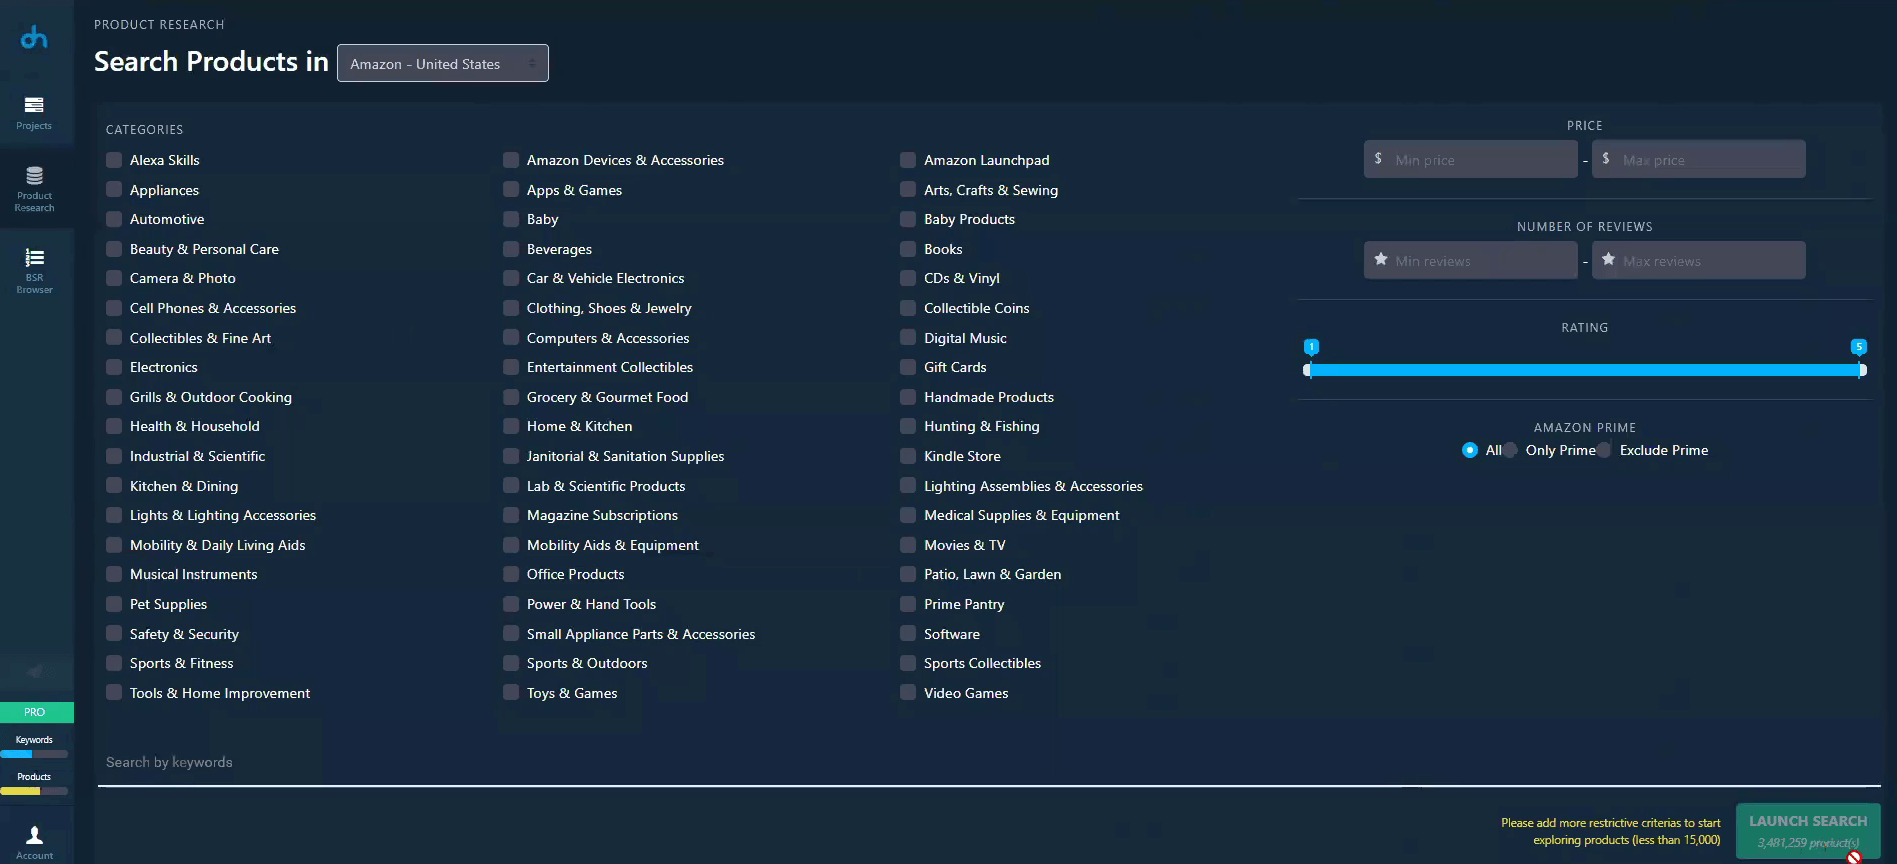
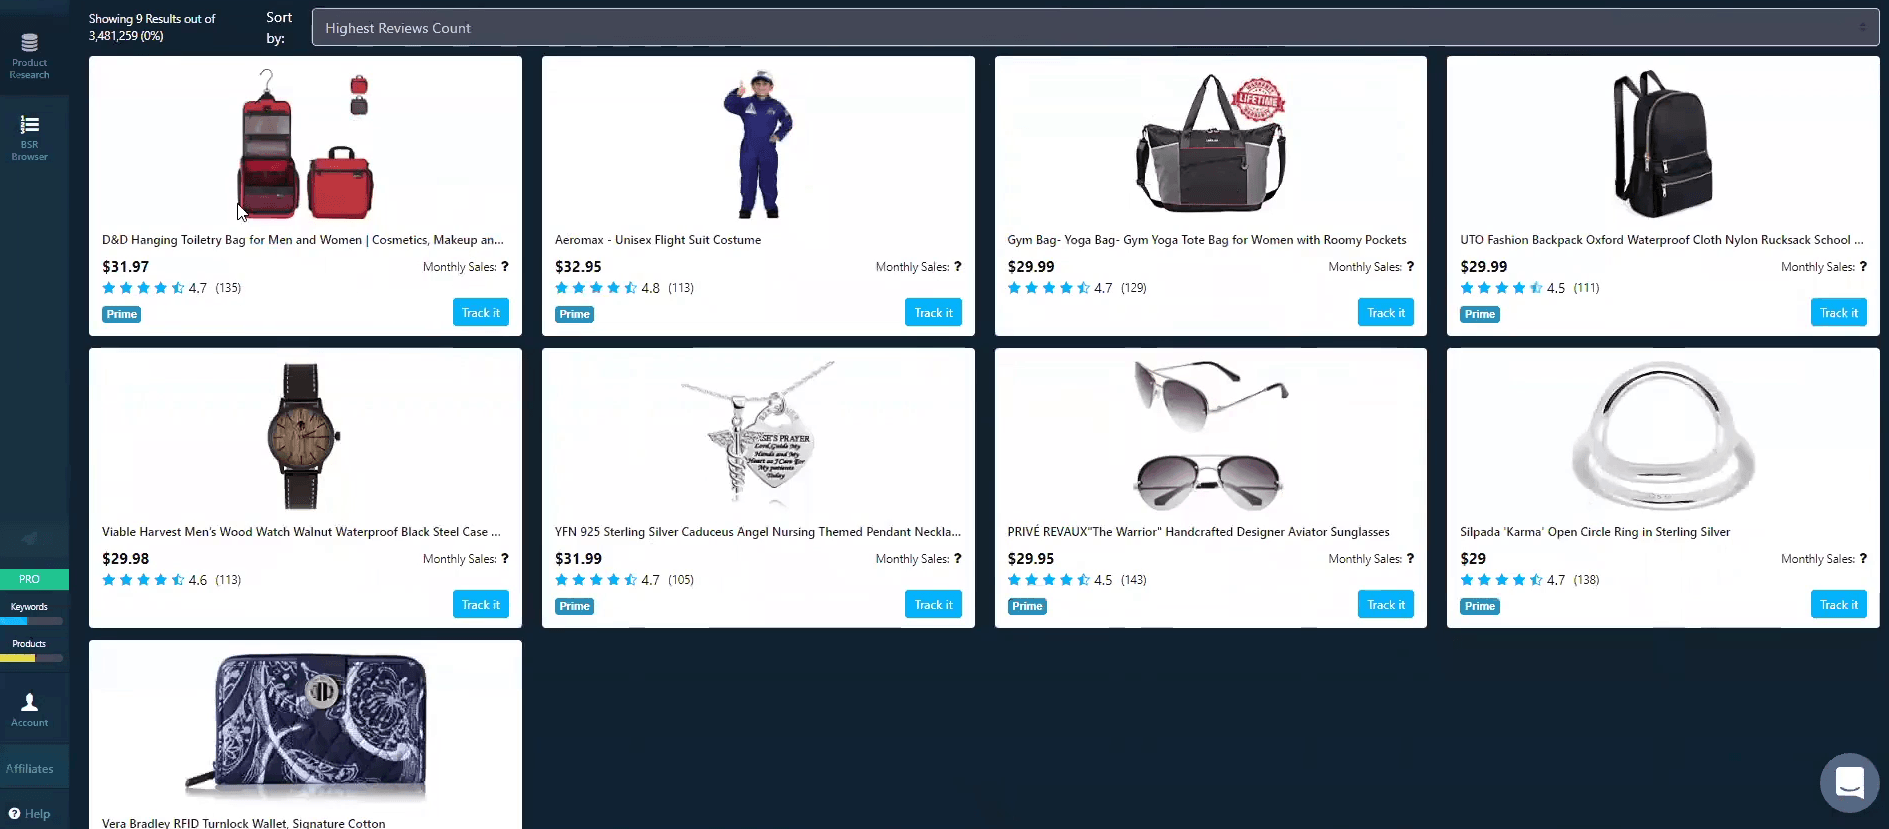
[42:38] Othmane: So it tells you that there are online products that correspond to this very precise criteria that you’ve seen here in our database. And once you haunting to those criteria, you can launch this search and after a few seconds you basically get the results that are corresponding to your criteria. So here, for instance, you can see a toiletry bag for men and women handwritten 35 reviews, 4.7 rating, $32, and if you want to unveil more data related to it, you can click on track it here and once you click on track it, it is going to show up on a dedicated project that you can create usually the default name that we suggest for product research, and basically what you can do afterwards is what I’ve shown you earlier, so go much deeper and dig deeper in terms of extracting information that you have around the product. Now, the other way that we helped with the product sourcing is a very cool feature that we have called the BSR browser.
[43:55] Othmane: And our BSR browser tool allows you to browse through up to three browser notes, up to three detailed Amazon categories, to show the top 100 products on each of those. So for instance, let’s say that you’re interested in the Clothing, Shoes and Jewelry category, we’ll go there. Then you can see all the sub departments are sub categories that are related to it. So Baby, Boys, Costumes and Accessories, Girls, Luggage, Travel Gear, Men, Women, and so on. So it’s loading, and so what you see here is the list of all the top 100 or so products that are in the Clothing, Shoes and Jewelry category. So this one, it’s recalled repel windproof travel umbrella. You can see the number of reviews it has, it’s price, and rating and so on. And again, if you want to track this in more details, you can click on the tracking button here, you can see there are some products from Hanes brand here, from Wrangler and so on.
[45:11] Augustas: And why does this table doesn’t have a score information?
[45:15] Othmane: Because none of those products are currently being tracked. As you can see, you don’t have information around sellers and our sales as well. The reason is that we can’t go and fetch the information for the entire database because that’s just massive volumes, so we do it on demand. And the way we do it is true that tracking component of our tool, which is basically saying using credits towards invading this sort of data that we actually track on a daily basis. So if you were to track this, you’d get the information and you’d get the monitoring on a daily basis. And now again, you can go to a subcategory, for instance, we went to the shoe jewelry and watch accessories. As you can see we’re in up to three notes now, and you can see the products that are ranking for it.
[46:15] Augustas: Alright.
[46:16] Othmane: So I think with that I have covered all the current existing features of DataHawk, as of September 2018, so there are a lot of other exciting stuff that we’re working on, happy to tell you a bit more about that.
[46:32] Augustas: Before we go into the future features, shall we cover the pricing of your software?
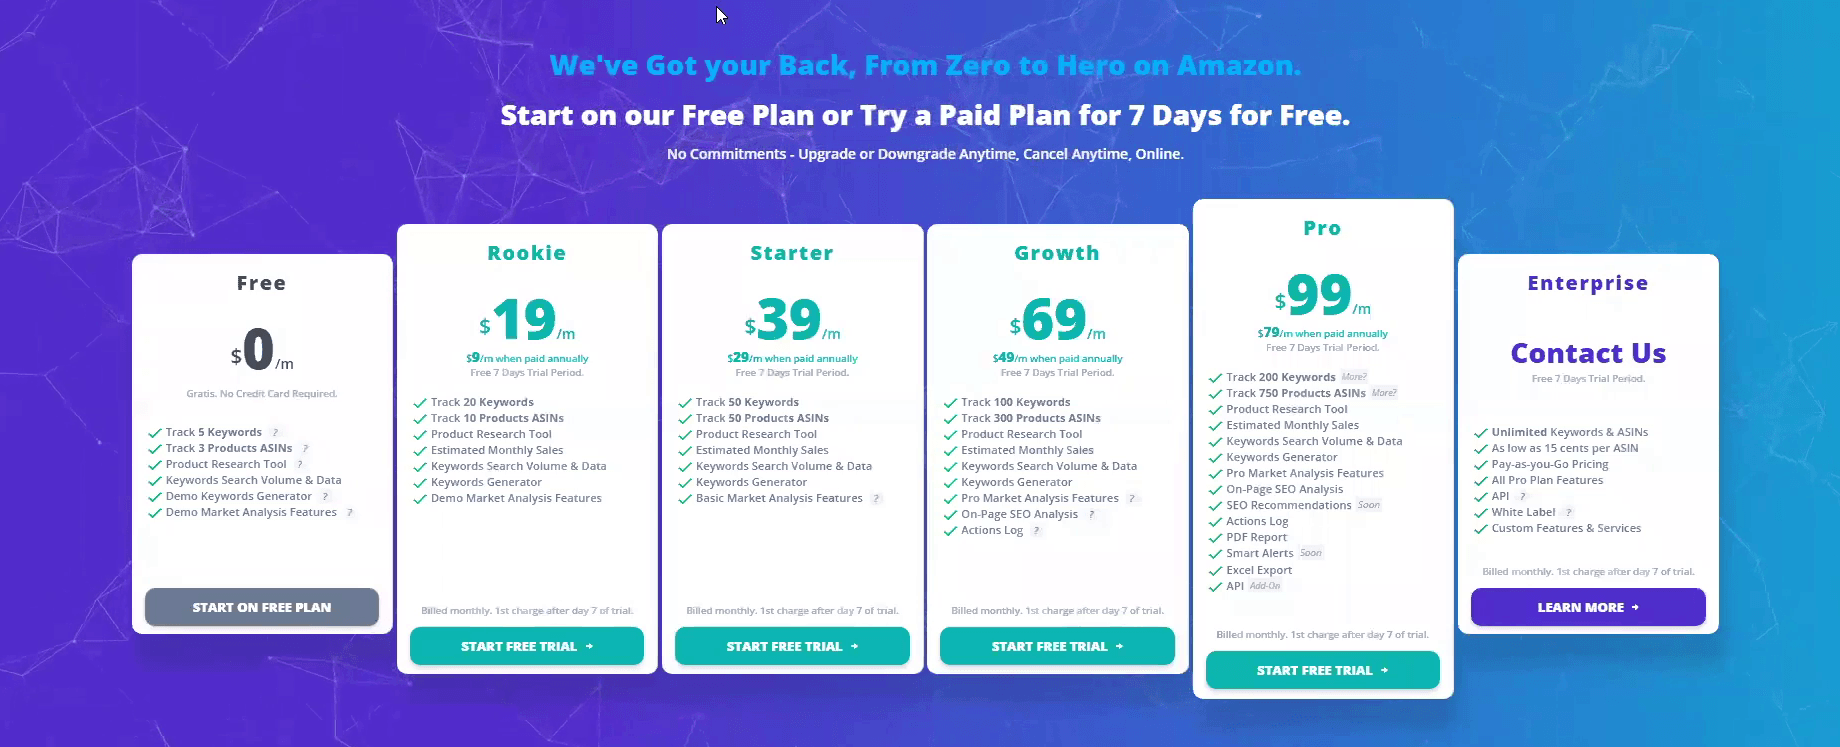
[46:40] Othmane: Yes, sure, absolutely. So our pricing for functions as follows, we have a freemium approach. So it’s a bit more basic, but it’s really helpful to small sellers that are just starting out there and want to have some basic information, so it allows them to track up to five keywords up to three ASINs, and get an insight into some of the other features that I’ve shown you with a much more limited way. And then the rest of our pricing starts at $19 per month, paid monthly, up to $99 per month paid monthly. And basically the differences between all those pricing tears is the number of keywords that you can track, the number of products that you can track. And some of the other features that I’ve shown you around market analysis, for instance, invading keyword search volume data and so on.
[47:41] Augustas: Thank you very much. I like that you don’t need to connect your Amazon seller information, so it’s not not implemented at the moment. And do you have any plans to integrate, seller central?
[48:00] Othmane: Yes. So absolutely we do because one of the things that many of our customers have been asking to, is allowing them to track their real sales data and so on, so it’s something that we’re working on. We’ll be launching it within the next 30 days, most probably. And I think it’s super interesting because when you’re able to draw correlations between your SEO performance, and your real sales and traffic data, it is at that very specific point that you really truly leverage the power of data and insights that we give.
[48:36] Augustas: And what other features are you planning to release to your customers?
[48:40] Othmane: We’re working on other stuff such as allowing them to track, for instance, which computers are competing on the buy box against them. I think this is helpful to sellers, more than private label brands that are brand registered. We’re also working on improving our reporting capabilities, and adding an alerting system, so allowing you to track, for instance, when you get a negative review when you have a sudden change or spike in terms of your BSR and so on. And also one of the things that we’re very excited about is a long chain more AI oriented capabilities that basically would allow you to get some really practical and recommendations around what you should do. So for instance, telling you, hey you should price your product at this price range and you should push your sales to assess velocity of 10 daily sales and so on, if you want to hit page position 1 for this keyword and so on.
[49:50] Augustas: That sounds like a virtual assistant.
[49:54] Othmane: Exactly.
[49:55] Augustas: Alright. And how do we contact support of DataHawk?
[50:01] Othmane: Yes. So that’s super simple. We have a chat app that you can see when you’re browsing through our website or you’re in the APP, and I think it’s really the best way of contacting us. We’re super reactive there, so it’s in the bottom right side of the screen, by clicking on it not only you can get access to our knowledge base with articles that can help you, answer your questions, but you can also just send us whichever query that you have and we’d be very prompt to reply. The other way of doing it is naturally through sending us an email, and that’s true that to open a support ticket there are links on our website and in the APP as well in which you can click on contact us and fill a form.
[50:54] Augustas: And final question, do you have any offer for DEMOMONDAYS viewers?
[51:22] Othmane: Yes, absolutely we do. So we’re excited to give 25% discount to all DEMOMONDAYS viewers that are eligible for up to 4 months. Just as they sign in, they should make sure that they ping us on the chat app again by telling us DEMOMONDAYS or that they are from DEMOMONDAYS, and we’d be happy to apply the discount.
[51:26] Augustas: Perfect Othmane, thank you very much and good luck in your business. Bye Bye.
[51:28] Othmane: Thank you Augustas.