SellerLegend is an Amazon Analytics toolset, which allows you to gain utmost clarity about your Amazon business performance. They report on a multitude of Key Performance Indicators in ways which are not available on SellerCentral or indeed on any other Analytics tool.
As far as their analytics features go, they aim to go narrow and deep. SellerLegend focuses on essentially the most important business indicators but they go extraordinarily deep to provide a very clear insight of Amazon seller business.
 Extended 42-day free trial
SellerLegend is presented by the co-founder Michel Gimena.
List of features covered in this video:
00:00:31 What does SellerLegend do and what problems does it solve for Amazon sellers?
00:01:44 What kind of Amazon sellers is SellerLegend built for?
00:02:33 Which marketplaces does it work right now?
00:03:33 Main dashboard overview of SellerLegend.
00:03:51 Product Lists and Individual product dashboards for each product.
00:04:14 Monthly Valuation – tells how many items are there in FBA and FBM accounts at the end of every month.
00:04:32 Comparison Engine and the Listing History – tells what are the listing changes that have occurred over time for each product.
00:04:51 Sales features: Orders, Removal Orders, Settlement Periods, Transactions, Sales statistics, Profit & Loss Report, Statistics Chart and Sales Heat Map.
00:05:48 Customer features: Customer List, Watchlist Reason, Customer Cross Sell and Geo-Tagging.
00:06:10 Refunds Manager feature: Manage Refunds Reimbursement – tells which returns have not been reimbursed by Amazon.
00:06:33 PPC features: PPC Dashboard and PPC costs.
00:06:54 Quality KPIs feature: Suppressed Listings
00:07:01 Shipments and Storage fees feature.
00:07:31 Main Dashboard features: general overview.
00:13:08 Single product overview and features.
00:18:45 Sales Statistics features: sales, taxes, fees, cost of goods, profit, etc.
00:23:31 What is the difference between Taxes and VAT?
00:24:10 Profit & Loss Report overview and features: Number of Units that you have sold, Gross Sales, Other Income, Promotions, Order Fees, Fee Refunds, Project Expenses, Business Expenses, Net profit and Amazon Payout During Period.
00:28:17 Inventory feature overview.
00:31:50 Monthly Valuation feature overview.
00:33:19 Listing History – allows you to look at each product and determine what has changed in your listing.
00:34:38 GDPR (General Data Protection Regulations) restricted view in the EU.
00:40:20 Manage Refunds Reimbursements feature overview.
00:44:45 Customer Segmentation feature overview.
00:48:53 Cost of Goods feature overview.
00:54:27 European VAT explanation.
00:56:04 Guest Accounts features- can define as many users as you want to give access to and for each user, can restrict what they can or cannot see.
00:59:25 Pricing.
01:01:52 Offer: get twice longer free trial: 42 days instead of regular 21 days.
01:02:06 Upcoming features. Click here to check the full list.
01:08:38 How do users and potential users could reach out to get the support team?
01:09:00 SellerLegend email address: support@sellerlegend.com.
Transcript – Walk-through of SellerLegend
[00:00:00] Augustas: Welcome back to another session of Demo Mondays. Demo Mondays is video series published on Mondays where I invite creators and founders of different Amazon seller softwares and I ask them to present their products just like this on the screen. And today my guest is SellerLegend.
[00:00:23] Augustas: And SellerLegend is presented by their co-founder, Michel Gimena. Hello, Michel.
[00:00:29] Michel: Hello, Augustas. How are you doing?
[00:00:31] Augustas: I am good. Please tell us about SellerLegend. What does it do and what problems does it solve for Amazon sellers?
[00:00:41] Michel: Right. Well, SellerLegend, in a nutshell, is an Amazon analytics tool set, which allows you to gain utmost clarity about your Amazon business performance. We report on a multitude of key performance indicators in ways which are not available on Seller Central or indeed in any other analytics tool. As far as our analytics features go, we aimed to go narrow and deep. We focus on essentially the most important business indicators, but we go extraordinarily deep to provide a very clear inside of your business. I feel it’s equally important to say what we are not. We do not offer any market research tools, nor that we offer features which would require us to perform screen scraping of Amazon properties. So that means no keyword tracking, no keyword indexing, no public reviews analysis or the like. We work exclusively with the Amazon APIs.
[00:01:44] Augustas: Great. What kind of Amazon sellers are you built for?
[00:01:49] Michel: We cater to all types of Amazon sellers, from beginners to experts. I used to spend the whole scope of Amazon business models, like product label, wholesale, drop shipping, retail or online arbitrage. We also offer a white label option if you’re an agency. And likewise, we do bespoke development on top of the plain-vanilla SellerLegend platform for large sellers.
[00:02:16] Augustas: It’s interesting. I have never heard someone offering white label for the software. So it’s a good option.
[00:02:22] Michel: It is an extraordinary option. And we are remarkably successful with it. In fact, about 50% of our business comes from white labeling.
[00:02:33] Augustas: Cool. And also on which marketplaces does it work right now?
[00:02:43] Michel: Right now we are allowing access to the Americas unified accounts and Europe unified accounts. So America is Canada, Mexico and the US. Europe is UK, Germany, France, Italy, Spain, and also we are currently beta testing Australia, which at the time this segment is aired it should already be available generally. And early August we will be launching in Japan as well.
[00:03:18] Augustas: All right. I think we have all the basic information about SellerLegend. So let’s see how does it look inside and how does it work? What features do you have?
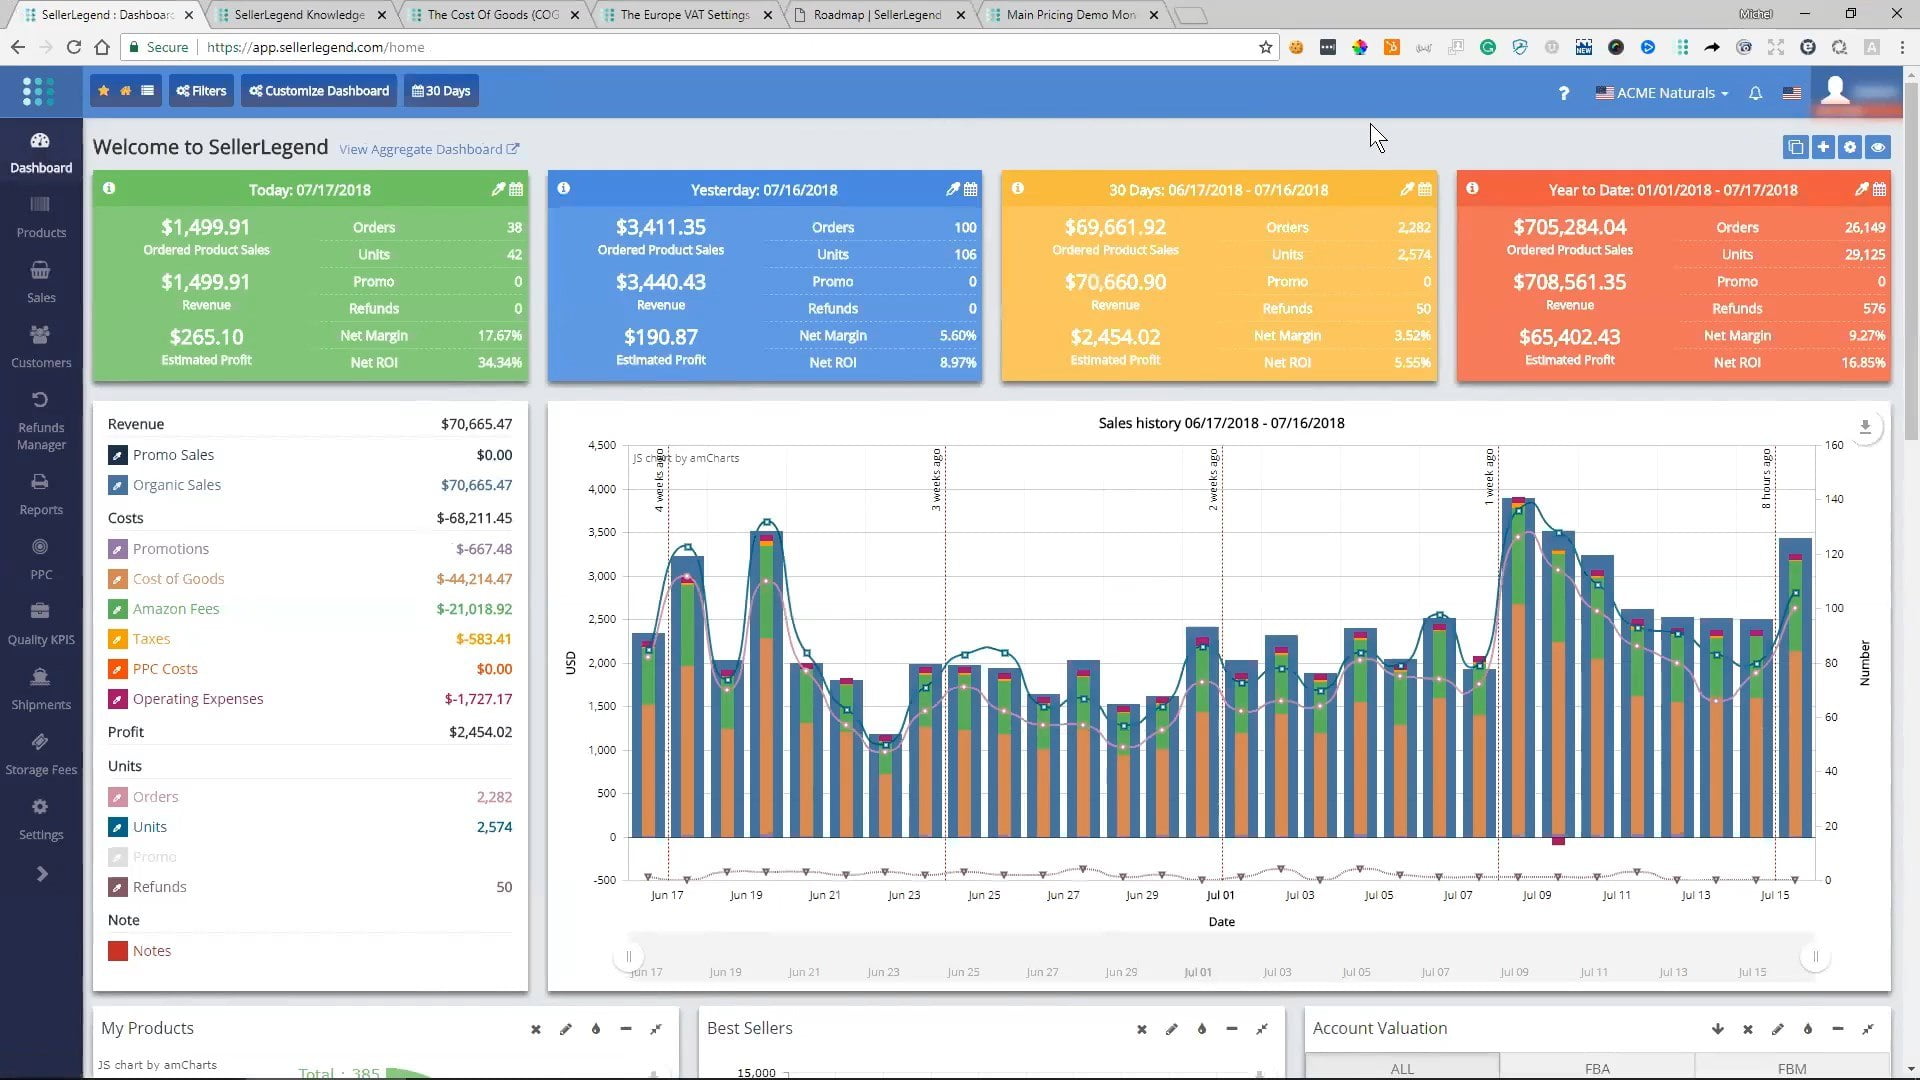
[00:03:33] Michel: Okay. Here what you can see is the main dashboard of SellerLegend. In fact, before getting into the individual strings. Let me actually show you the breadth and depth of functionality that we provide. We obviously have a dashboard, but will show you all your products and we got Product Lists.
[00:03:58] Michel: We’ve got individual product dashboards for each product. We tell you about your brands. We gave you all the details of your inventory and what needs to be reordered by when, and how much it is going to cost you. We had a Monthly Valuation, which means that at the end of every month, we tell you how many items you have got in the whole of your FBA and FBM accounts. And we’ve got a couple of beta features which is Comparison Engine and the Listing History, which actually tells you for each one of your products. What are the listing changes that have occurred over time. In sales, we show you the detail of all your Orders and your Removal Orders. We go into great length in showing you your Settlement Periods, your individual financial transactions, Sales Statistics, which is probably our most utilized screen of the dashboard.
[00:05:16] Michel: We run the Profit & Loss Report, which goes into very great detail in all the fees and the sales that you have. We got Sales Statistic Chart and Sales Heat Map, which will tell you when your highest funds are, where you got sales and likewise. What are your busiest hours of the day and business hours of the month. In customers, we’ve got obviously Customer Lists. We provide a facility to watchlist customers, will get to that later on. We provide a beta feature which allows you to analyze all your customer cross selling and we provide Geo-Tagging facilities. We do have Refunds Manager. Which has only got one option, which is the most difficult option to address, which tells you which returns have not been reimbursed by Amazon. We’re going to that a little bit later in detail and we show you all the returns and all your reimbursements.
[00:06:33] Michel: We do have a PPC feature, which has got PPC Dashboard and also tells you all your PPC costs. But I won’t be able to go into the detail of that today because unfortunately the test account that I’m using here does not have a PPC connection. Then we’ve got Quality KPI’s for which we are showing you the Suppressed Listings. And also by the time this goes live you will also have the Customer Feedback. Not the Product Feedback but the Customer Feedback. And then we tell you about all your Shipments and we have got screens that deal with Storage Fees. We’ve got multitude of Settings which we are going to be looking at in some detail. Let me go back to the Dashboard. And in the Dashboard you got all the Sales KPIs.
[00:07:43] Michel: In essence at the top here, you’ve got individual files which allow you to see on a period by period basis. The most important KPI’s. You can add additional tiles if you want to, by clicking on this. And you can select any period that you want, for example, if you want to have a look at the last 180 days. It will automatically generate a new tile with all the details. You can add as many tiles as you want. And you can indicate which periods you want to address for every time. In the dashboard, we give you a bar chart of all your sales on a day by day basis with a legend on the left hand side that indicates the details of every single day as you hover on these bars. And then we got a multitude of indicators. You’ve got the number of products that you got, how many are active, how many hold the buybox and how many are inactive.
[00:09:04] Michel: The best sellers, the top 10 best sellers. You’ve got an Account Valuation that tells you all your accounts. On this SellerLegend account actually has got 5 different US accounts in it. And for each one of the accounts we tell you how much the inventory has cost you. How much cash you will get out of the inventory and what the retail value of the inventory is. The accounts here show zero in cost because these have been very recently on-boarded and we do not have yet the cost of fields defined for those accounts. We give you a Relative Performance by Marketplace. So for the 5 marketplaces that you’ve got here, which are those 5 US accounts. We will tell you that Relative Performance for this particular ACME Naturals marketplace, we give you all the Returns by Disposition. So this is a breakdown of all the returns that you have got over the period of 30 days.
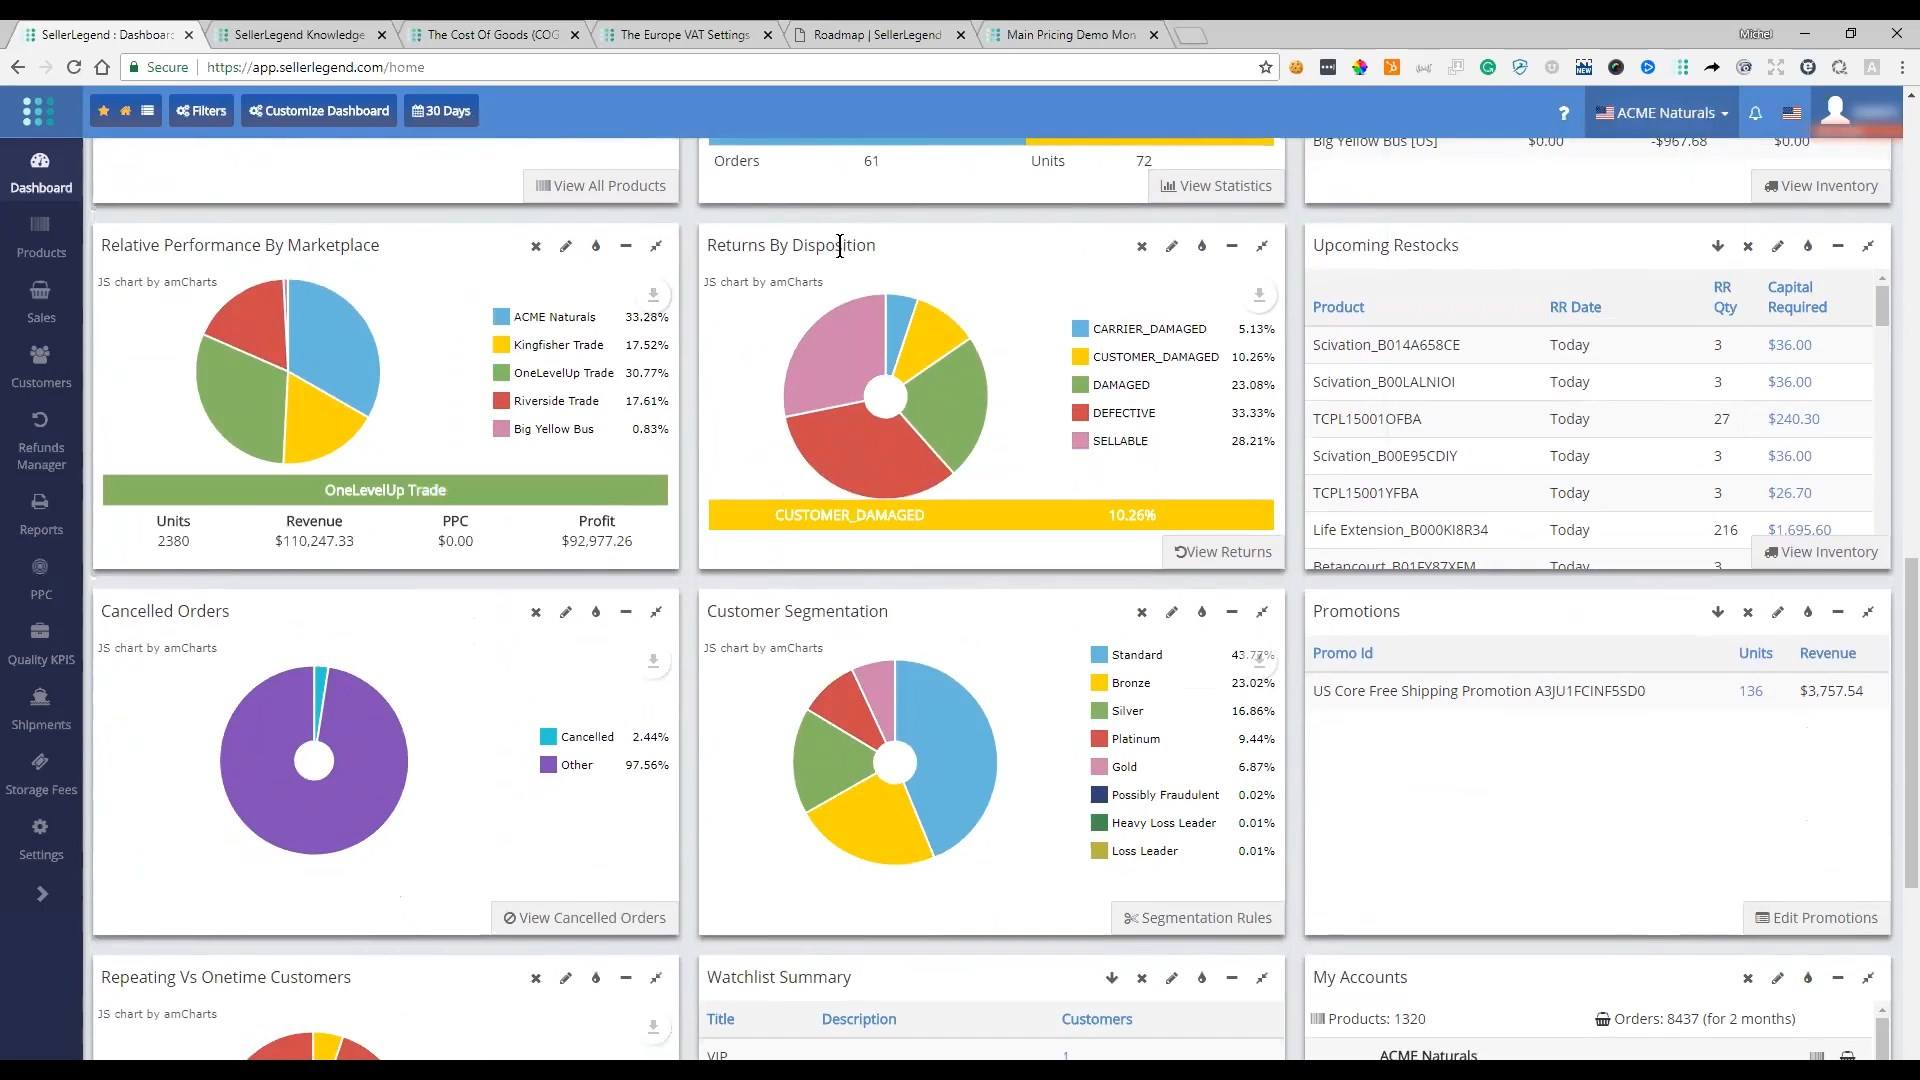
[00:10:23] Michel: And we breakdown the disposition that those returns has shown. So for example, you can see that out of all returns, only 28% came back in a sellable condition. We indicate all the upcoming restocks for that marketplace, the product, the recommended re-order date, the recommended re-order quantity. And the amount of capital required for that particular quantity. We give you the proportion of Cancelled Orders against the normal orders. And here, we tell you how your customer base is segmented. Will come to this in detail. You will be able to define up to 10 different criteria with different thresholds. And we will then force segment all your customers in one of these tiers. And we will tell you what proportion of those tiers your customer base is stratified with.
[00:11:35] Michel: We show you all the Promotions, the promo codes that you have, the number of units that you have sold in that particular period, and the total revenue. Now, in this particular account, this is a drop shipping account, which explains why the return on investment and the margins are really paper thin. So because it is drop shipping, they are not using Promotions and that’s why you can only see one promo id which is the standard core free shipping promotion. We give you the proportional Repeating versus Onetime Customers. We give you the option to watch this customer’s. You can determine why you want to watch these customers and if there are specific conditions that your customers exhibit, they will automatically be assigned the particular Watchlist code. And eventually you have got here a list of all your accounts and how many orders and products each one of the accounts has and what the data recency is of each one of those accounts.
[00:13:08] Michel: That is the top view of your account. But of course you will want to see for each individual product how you’re pairing. Well that’s quite easy to do. If you go to Products, you can go and see for each individual product what your situation is. You select a product here. You will be shown the status of that product. Again, same thing, the tiles with the sales history details and the legend of the sales history. And down here we’ve got individual widgets, that relates to that particular product. You got the proportion of the canceled orders against the normal orders. You got the PPC costs history. But as I mentioned in this instance, we do not have PPC details for this account as it is a test account.
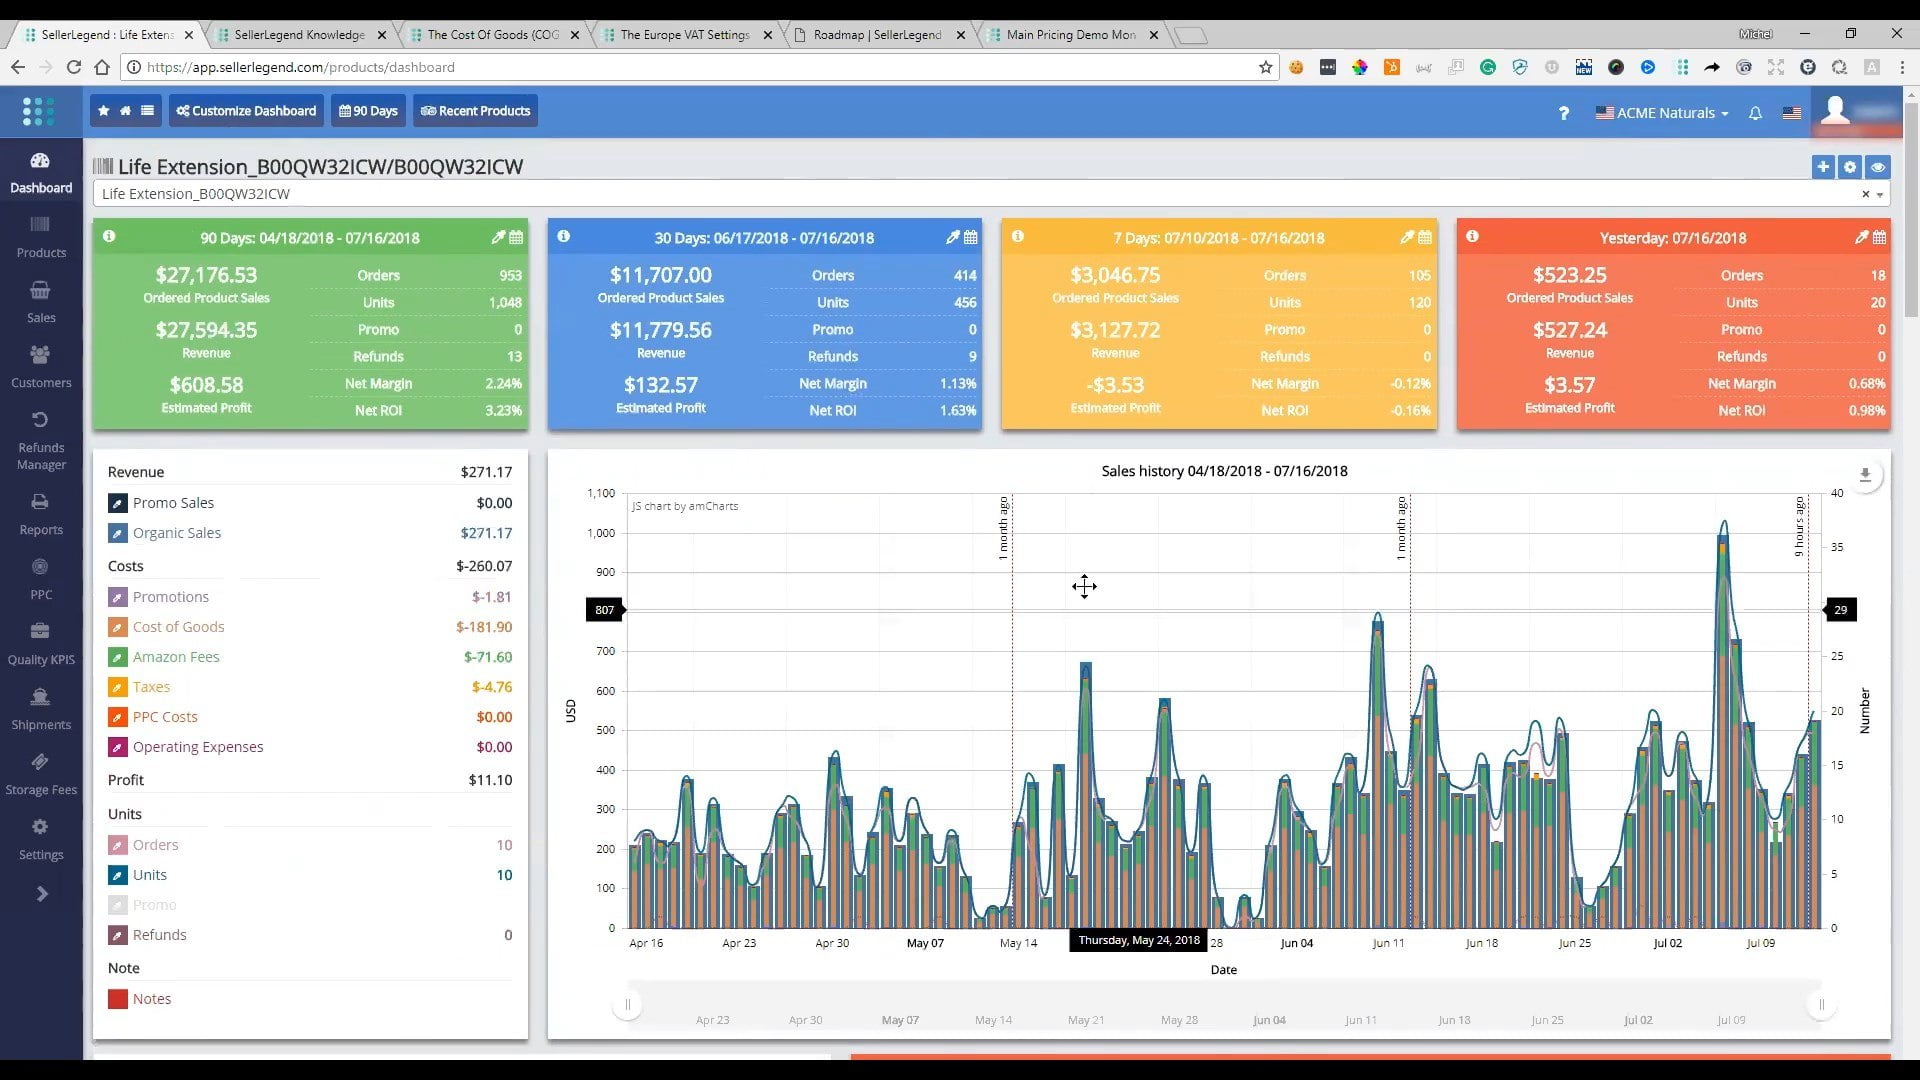
[00:14:17] Michel: We give you the individual Product Valuation for this product. So that means for this product here, which is live extension, and this is the ASIN, you have got $9,495 of inventory. Out of which you could extract $3,925 profit. And the retail value of that at the sale price is $17,748. Here we got a widget that allows you to look at lots of different data points and we can compare the data values. Now you can declutter the graph, for example, let’s remove the categories. And let’s only look at, for example, the Price versus the Units Sold. So here you will see this are the different prices at which those product has been sold. And here are the number of units sold. You can determine whether you had the Buy Box or not. You can see that you got the buy box during that period of time.

[00:15:39] Michel: And here it got all the financials that relate to the product. Your got all the prices, all the fees, the VAT percentages, what the Break Even prices, return of investment. You name it, you got it here. All the inventory details for that product, including the age level of the product inventory, all the other identifiers of that product. And here we have got Units Sold by Price Points, that means that product has been sold over that period of 90 days at that particular price point. And for each price point, you’ve got the number of orders, number of units, revenue, profit, profit by unit, first and last order date. Again, here we are telling you all about your Product Dimensions Data including the Product Size Tier and all the elements that you will need to calculate an international shipping if necessary.
[00:17:00] Michel: This is a widget that shows you the Units Sold by Cost of Goods. The cost of goods over that period of 90 days has not varied. It was at $18.19 and you sold 953 orders, 148 units. This is your revenue and your profit. We tell you about your Product Refund Rate. So you have had for this profit 1.24 refunds in total, which is not bad. We tell you all about your Categories and Sales Rank, whether your customers have bought this product on a repeating basis or just one time. So 5.5% of your customers have ordered that product multiple times. Here we are showing the Promotions specifically for that product. We will allow you to enter product notes. And we also show you the customer Segmentation for this product. In other words, 84% of your customers fall into the bronze category and when we come to describing what Customer Segmentation is, you will see that bronze actually means something specific to you and specific to that marketplace.
[00:18:24] Michel: And finally, we tell you your Returns By Disposition. For this particular account all the returns were returned in sellable condition. So this is for each individual product. All the key performance indicators that we have here. Now, of course, you won’t want to just look at individual products. You will want to see all your products at a glance. So that’s why we have in Sales, we’ve got Sales Statistics. So the Sales Statistics is probably the most used screen that we have because it really gives you a good view of the performance of your business. For this particular marketplace over the past 30 days, here are all the products that you have sold. And for each one of those products, we tell your number of orders, number of units, the velocity, that is the number of units that you have sold that product over the past 30 days per day.
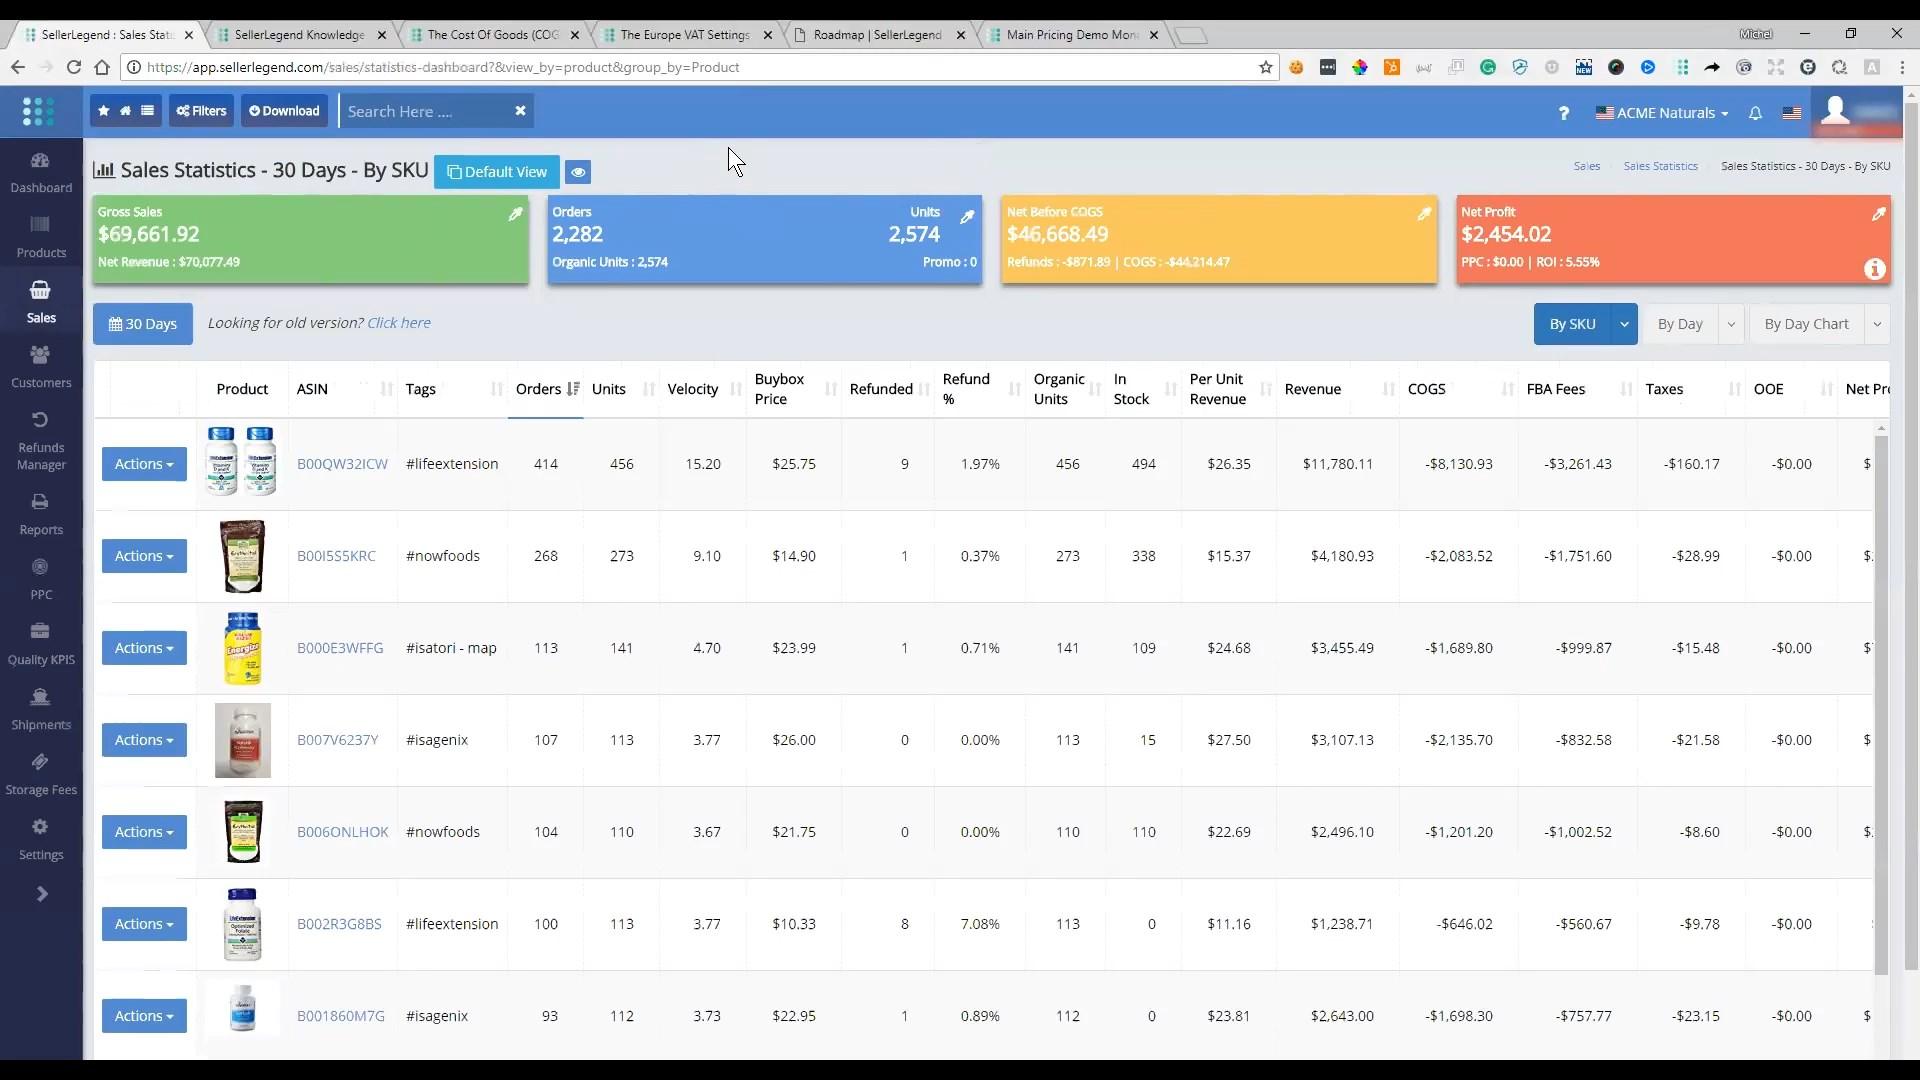
[00:19:40] Michel: The BuyBox Price. the number of items refunded the percentage of Refunds, the number of Organic Units, the number of In Stock units, Per Unit Revenue, Revenue, the Cost of Goods total, the FBA fees for that product, the taxes, other operating expenses, because we allow you to record operating expenses that have got nothing to do with the sales aspect, but you can actually assign operating expenses to individual products. The Net profit, the net margin, the net ROI, the Sales Ranks for that product, and the number of items Inbound. Not only do we tell you that for all the products that you have sold within that period, we can also show you that you can actually change the period to whatever you want, including a custom date range. But we can show you that by SKU, by ASIN, by Parent ASIN, by Brand or by Product Group.
[00:20:49] Michel: Product Group are a means of combining live product into a specific group. And then you can report on the content of that group. So the aggregate of all the products in that group is actually reported, but we can also show you this by day, by week. So this is now by SKU, but we could break it down by a week in those 30 days, we will see that in those 30 days we got 6 weeks probably because the starting week was over the 30 days and the ending week was over the 30 days as well. And here the color coding actually tells you whether you have gone up or down during each individual week. Not only can we give you that by week, month, quarter, semester or year. We can give you that by chart, and we can give you that in the daily chart if you want to.
[00:22:12] Michel: So the last 30 days in the Daily Chart. Again, with the typical bar chart which shows you in blue the actual revenue and in stacked bar chart, all the expenses. But we can also show you that in a week by week or month by month. So you could change this, for example, to let’s say 180 days and portray that in a chart by quarter. Not only can we do that for all the products simultaneously but you could go into an individual product by SKU and for example, take any product here and say view this SKU by periods. So you can now pinpoint every individual SKU and break it down into periods of 180 days on a day by day basis. So these are the days where you have had a sales activity for this particular product
[00:23:31] Augustas: Michel, I wanted to ask. There are two columns, taxes and VAT. What is the difference?
[00:23:37] Michel: The difference is because we differentiate of course, whether there is a US account or an Europe account. In the instance where you’ve got the US account, you will see the taxes being populated and if it is an Europe account, you will see a VAT being populated.
[00:24:00] Augustas: Okay. So it’s sales tax for US people.
[00:24:03] Michel: It’s sales tax for the US.
[00:24:05] Augustas: Okay. Good.
[00:24:10] Michel: While we are at the level of the product. Let me show you now the Profit & Loss. The Profit & Loss Report is a breakdown of all the events that we take by month. It’s going to be easier to see. So you give us a date range and that range date range can be anything you want, including a custom range, nothing here.
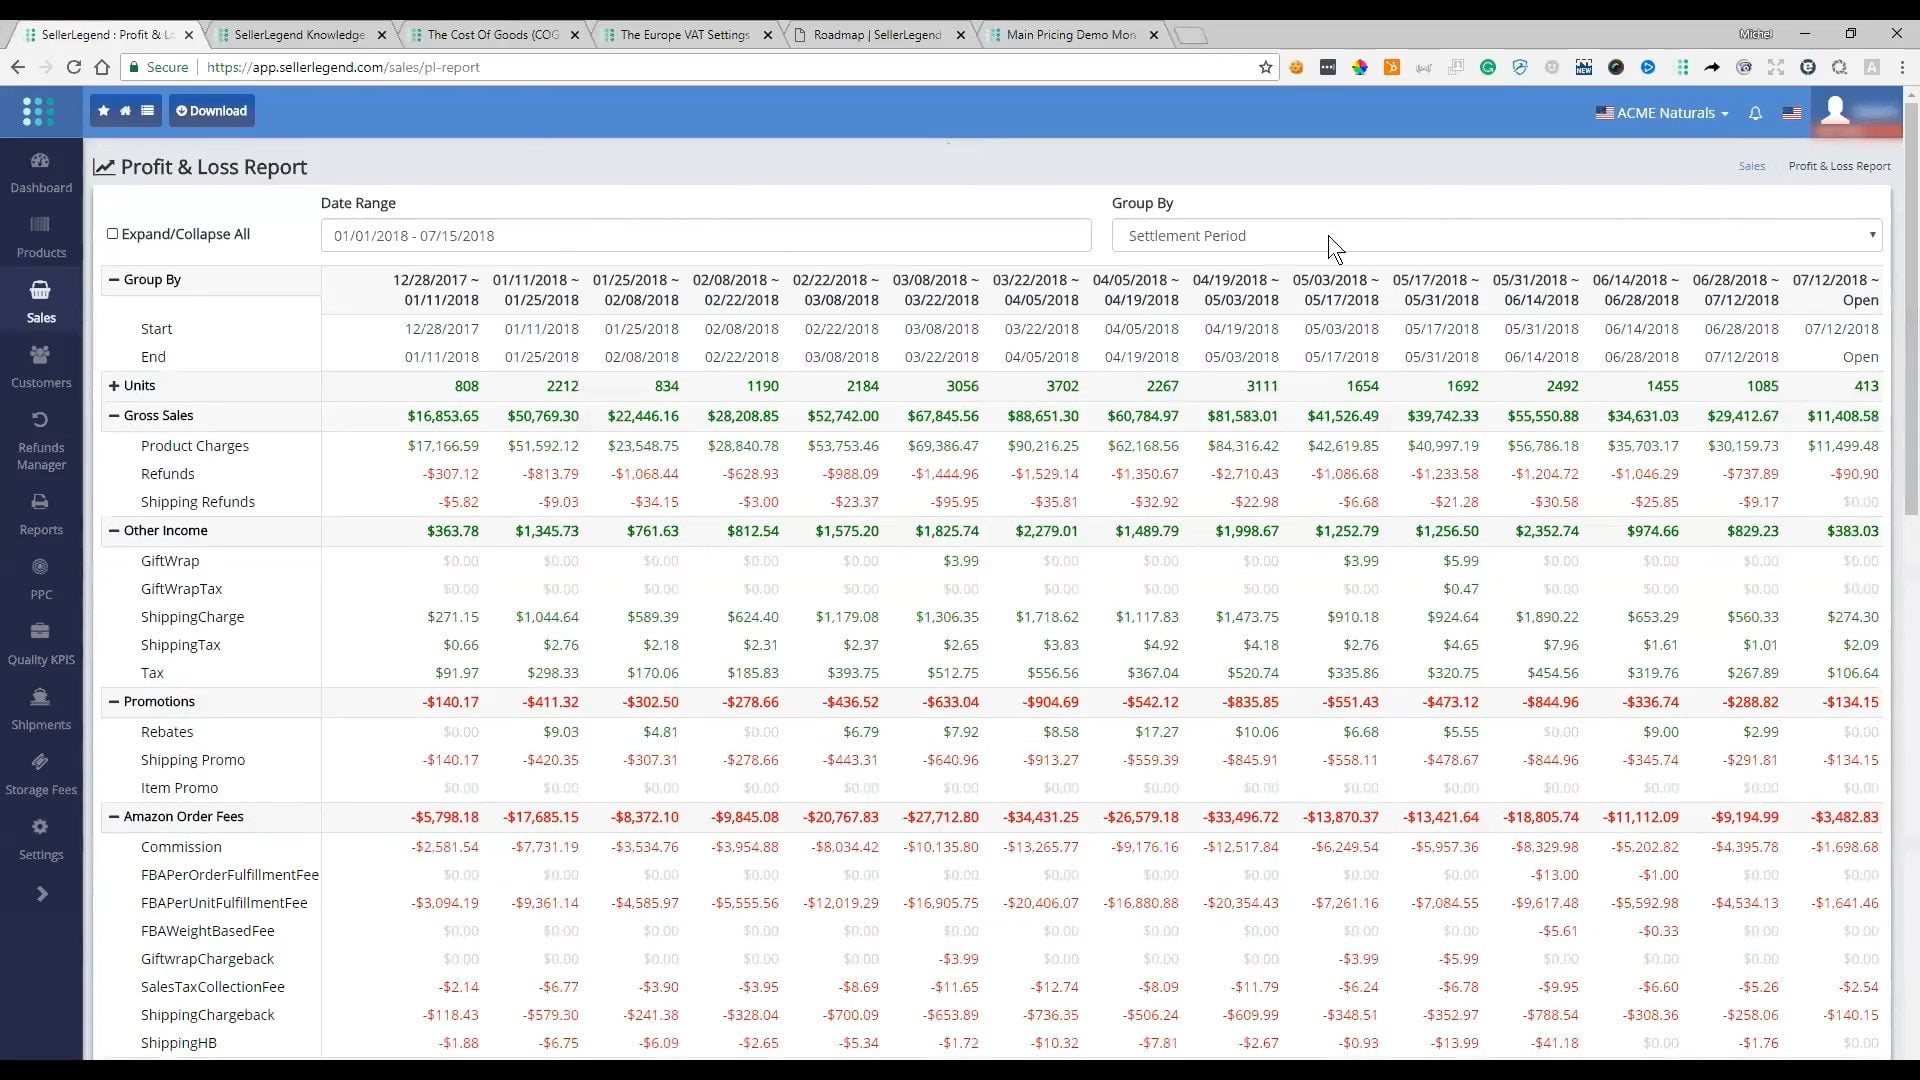
[00:24:44] Michel: What we’ve got is from the beginning of the year until the 15th of July. And we show you the breakdown by month in this instance, but you can break it down by day, week, month, quarter, year, by settlement period or you can break it down by individual products within that date range or by brands or by product groups. And essentially what we gave you is the number of Units that you have sold, the Gross Sales, the Other income, all the Promotions and all the Order Fees and all the Fee Refunds, all the product adjustments and all the other Amazon Fees, this are probably the ones that you may be more interested in. You will see that we actually put any Amazon fee that Amazon see fit to charge you with. We will show you when the fee has been settled and how much it was per period that you have decided to aggregate.
[00:26:04] Michel: So then we also go into the Project Expenses, which is Cost of Goods, any other Operating Expenses in this instance, it doesn’t seem to be have any operating expenses, the PPC, which as I said we do not have the PPC connection, however, Amazon have charged some PPC amounts. So once I cannot show you the details of the campaigns or the product ads or the performance of keyword performance or social. We do retrieve from Amazon the fees that have been charged, taxes and the VAT. You can see this is a US account. So you’ve got the sales tax and no VAT. And here you got all the Business Expenses that have been entered within SellerLegend, which is separate from what we retrieved from Seller Central. And you can have any type of expense that you want, you can classify that expense in a specific groups, and actually will give you the net profit, the amount that Amazon has actually given you in terms of payout during that period.
[00:27:35] Michel: Now, as I mentioned, you can also show that by product. So here is going to breakdown all this in the individual products and you will have the same breakdown by product. Now notice that the other Amazon fees or not fees that can be attributed to specific products so there for they are blind. Likewise, the Business Expenses. Unless the business expense has been assigned to a product it will not appear here in the Profit & Loss. All right, let’s go now to the Products. The most interesting part is going to be the Inventory.
[00:28:30] Michel: And in the Inventory we show you all your products that are active. We show you all the details, Fulfillment Channel, how much you’ve got In Stock, how much Inbound, Reserved, the Total Quantity, the Per Unit Cost of goods, how much money that got tied up in the inventory, the Per Unit Price, the total Retail Value, the estimated Profit Per Unit, and it goes on and on and on. How many you got in local inventory In Transit, In Warehouse, the Age Level. We gave you the breakdown. The velocity of that product over 30 days which is what is calculated here. But you can of course select any period that you want. We can’t relay to you for you how many Days of Inventory you’ve got. We tell you the Recommended Reorder Date. How many you should be reordering.

[00:29:36] Michel: Notice that here. Some of these products are way overstocked. But here is one that is reasonably stocked and it should be restocked on the 16th of August. And the Reorder Quantity, given the Velocity over the past 30 days should be 819 units, which is going to cost you $6,273 at the current cost of goods of that particular product. And here is your ROI and your Margin. Now how do we calculate all this? And that’s because you can give us by product, the criteria that he want to utilize. So you can go here and you do Edit Product. You’ve got several settings per product and here are all the Inventory Settings. You can tell us what the Restock Lead Time is, how many Days of Cover you want, what the Minimum Order Quantity is, how many you got In Transit, In Warehouse.
[00:30:50] Michel: Whether you acquire those goods by crate or not and you can give us the Crate Quantity, if we divide the number of products by that crate quantity and we come to a number that is not a whole number. You can tell us whether we should round up or round down that number. And that’s the amount of units that we will calculate for you to reorder. So you can specify that at every individual product, but it can also specify that in general so that all the products that do not have an individual inventory settings has their own mechanism of calculating the recommended reorder date and reorder announced. So let’s move swiftly on to the Monthly Valuation, which I told you is a way for us to tell you per product.
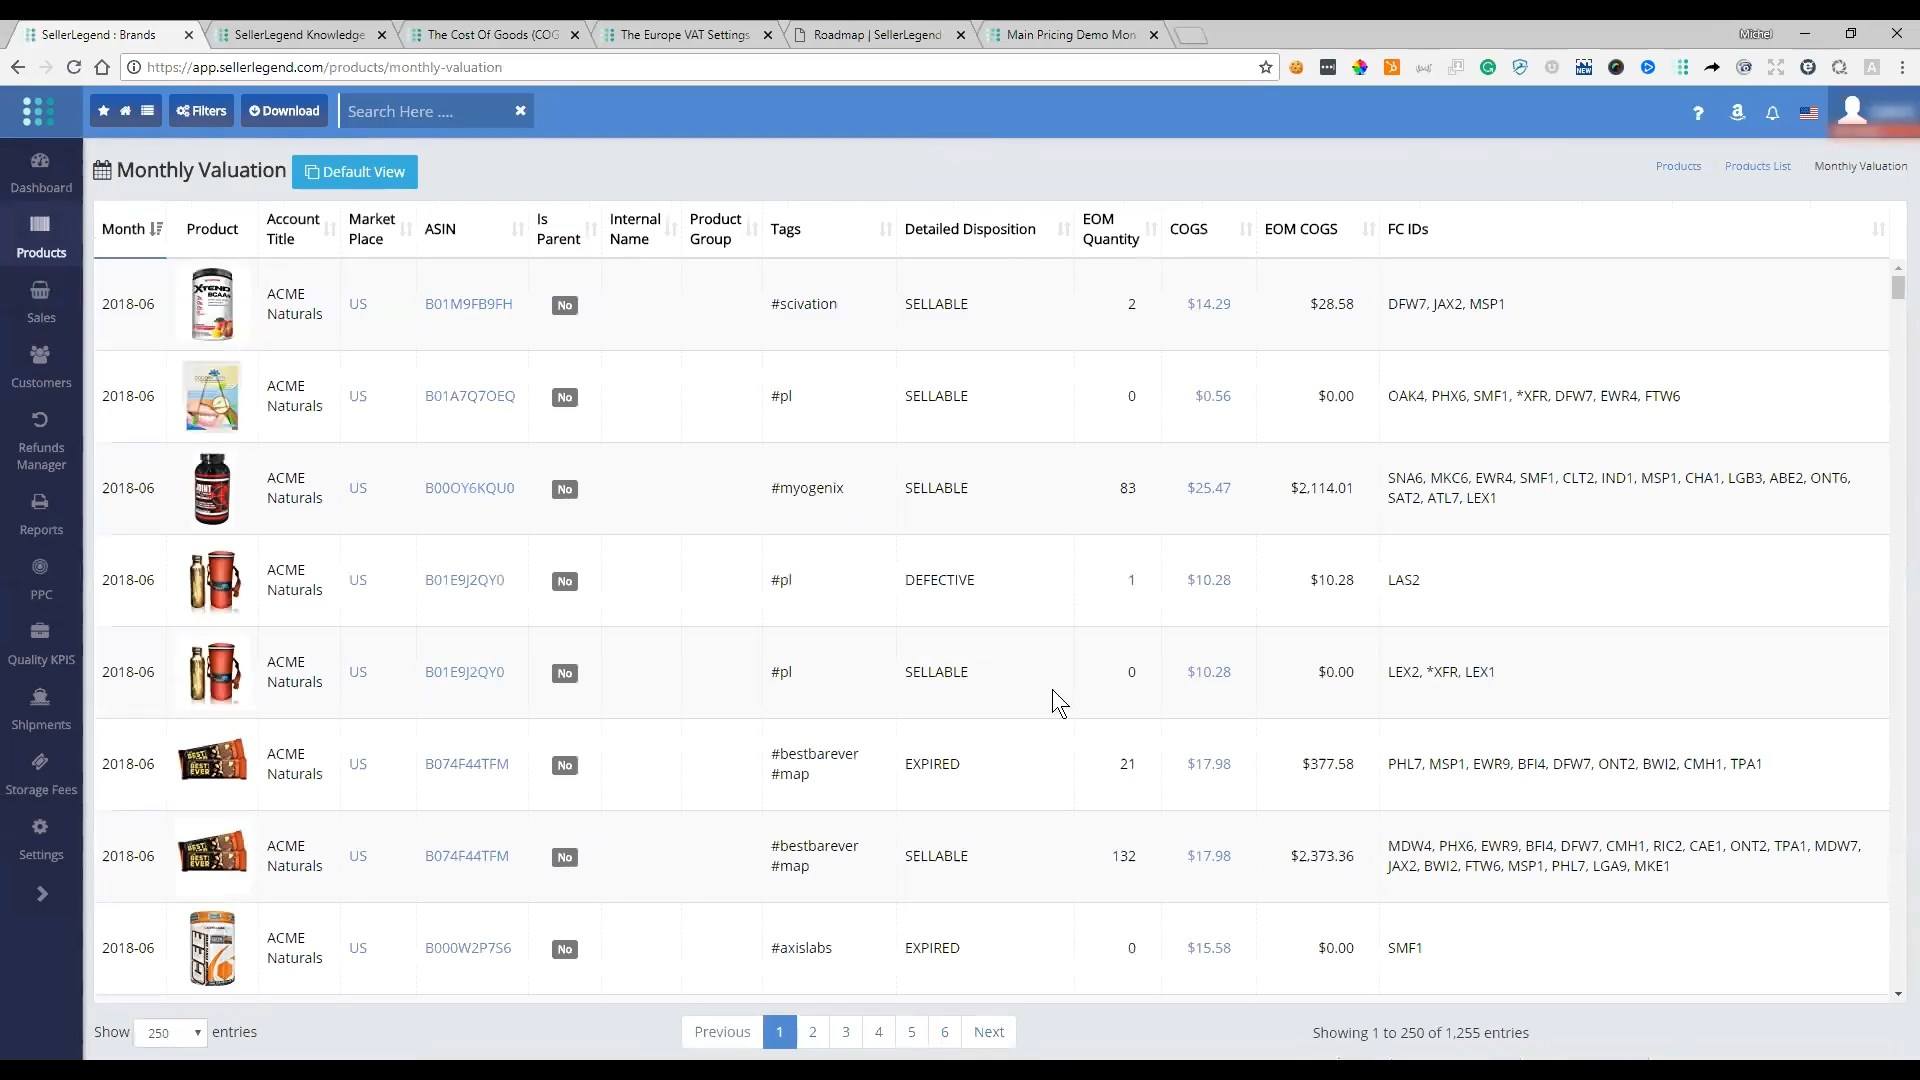
[00:32:09] Michel: At the end of the month how many units do you have in what Disposition? how much Cost of Goods is allocated to each quantity. So, in essence, what you would do with this is you would get this on a month by month basis. And we will tell you for this product, you have got two units which are in a sellable condition, but you may also have the same product in a defective condition. So with this, we can pinpoint for your accountant what your end of month position was at the individual detail disposition and also tell you in which Fulfillment Centers that product was located during the month. So we also have a Listing History feature which allows you to look at each product and determine what has changed in your listing. So for example, let us take any one of those and let’s go to the Listing History here.
[00:33:46] Michel: And we will see all the changes that have happened in that product listing. So for example, here is the listing as of Sunday, the 25th of February and compared against the listing as Tuesday, 3rd of April, and you can go back at any point in time and compare the changes that have happened to that product. Now, unfortunately, Amazon in the immense wisdom decided that they would remove from the API access the bullet points. So unfortunately we no longer report on the bullet points because they are no longer available in the API.
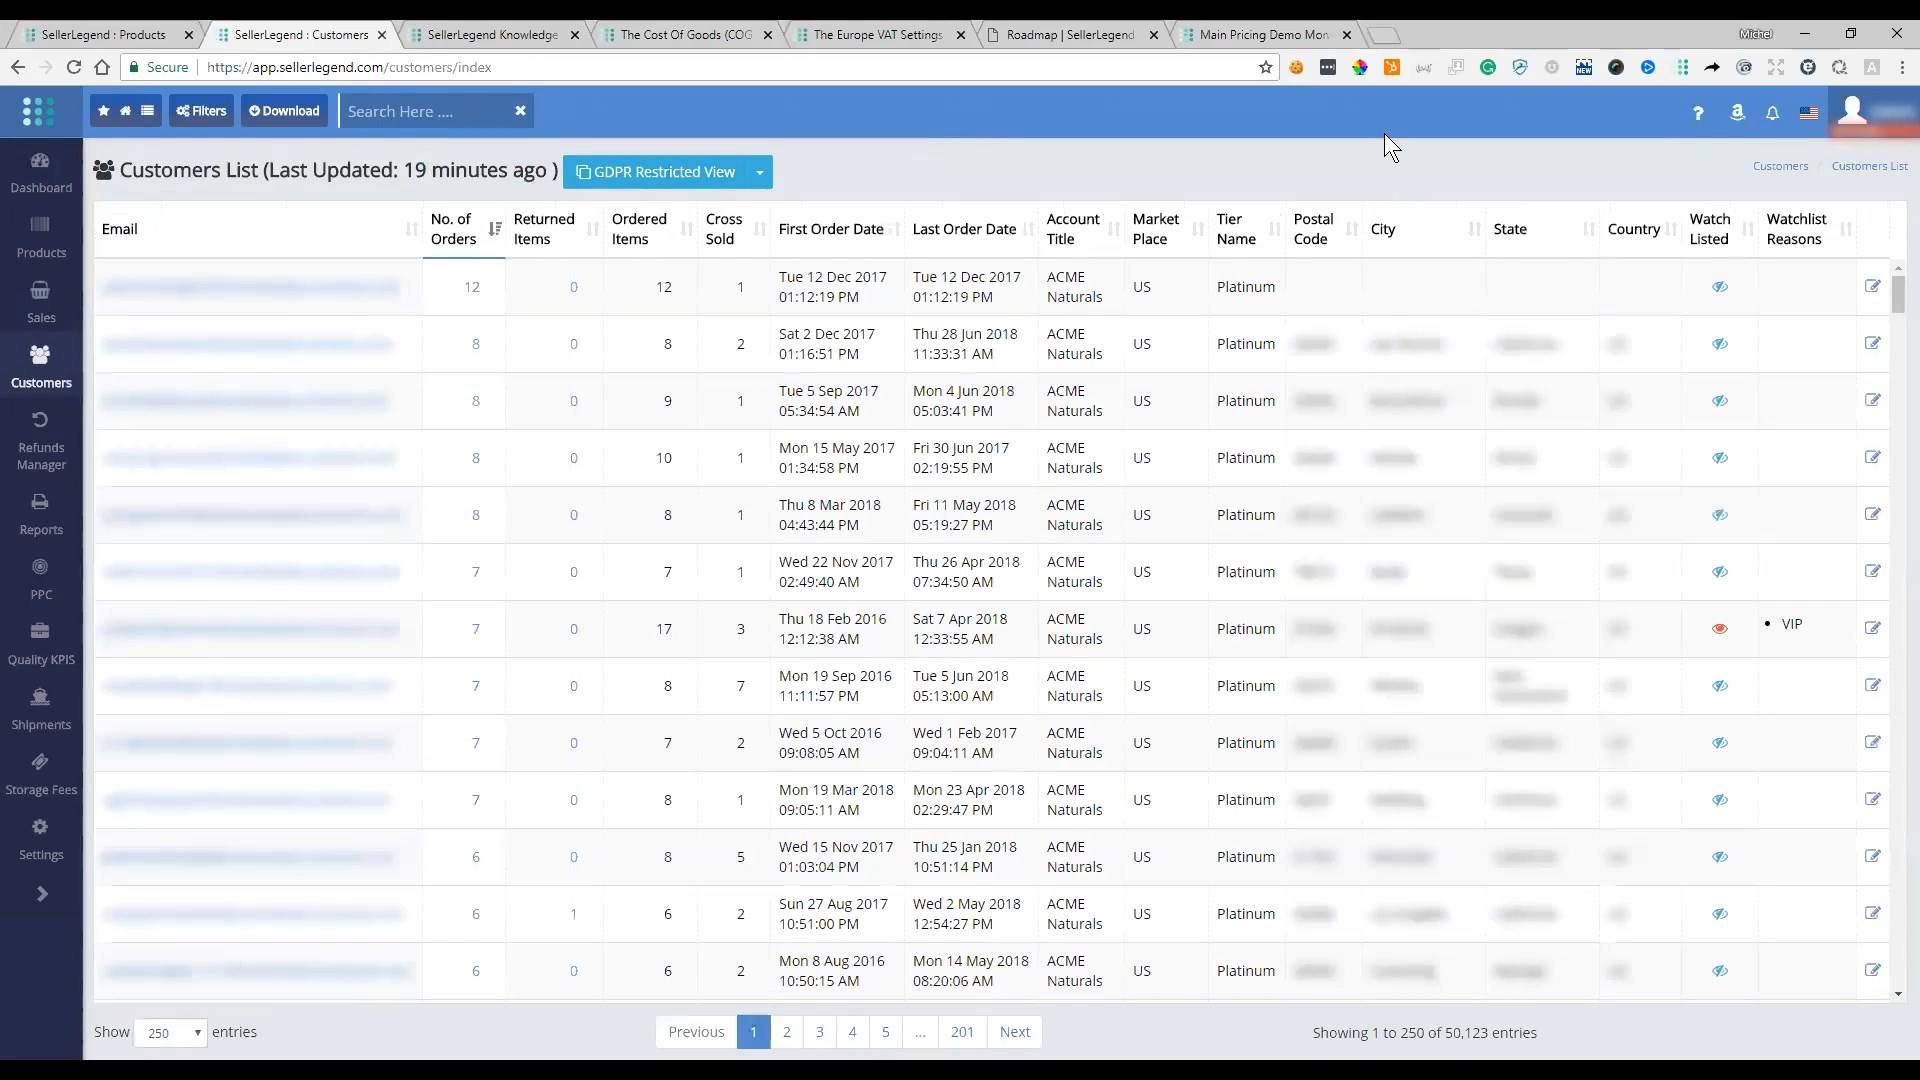
[00:34:38] Michel: Okay, let’s go now to Customers very quickly because I’m conscious of the time. We obviously kind of show you all the customers now here in this instance, because of GDPR, the General Data Protection Regulations in the EU. I am not allowed to show you any customer details because that would be a big no, no. So we have got a GDPR restricted view. You may have noticed that on any of the screens we have got views and you can actually define as many views as you want for a specific view. So here you can determine for example, here I have removed name, first name, last name and phone number because I did not want to show you that I’m not allowed to do that but I have left everything else which is not customer identifier. And so here you can add or remove any columns that you want.
[00:35:50] Michel: You can move columns, left, right, and center. You can actually colored columns. For example, if for some reason a number of orders was important to you and you wanted to highlight that column. You set the color and you will see that the number of orders column is now highlighted in red. You can actually highlight any problem that you want in any screen, in any color that you want as well. All right. so I am saying that you can have any view of any screen with any columns. We can reorganize your columns. We are now working on allowing you to identify conditions in the cell. For example, you could color code a cell in ordered items, anything above 10 for example. And that particular cell will then be color coded accordingly. We’re also working on a feature which allows you to create custom columns. So you will decide, you can add columns that are pertinent to use specifically and you can enter any data in it. So you will be able to edit the data in those columns. But we will also allow you to do calculations on those columns. Either based on data that we extract from the API or data that you have entered in custom columns.
[00:37:42] Michel: All right. So talking again about the customers, you will see that we tell you the Number of Returned Items and Number of Orders, the number of Ordered Items. Whether you have cross sold to a customer, meaning that customer has bought from you more than one distinct SKU. The First Order Date, the Last Order Date, the Account Title, Market Place, the Tier Name, which I still need to tell you what Customer Segmentation is all about. The details of the customer, whether the customer is Watch Listed or not. For example, this customer is Watch Listed as VIP will come to touch this thing a little bit later on. So you’ve got the ability to download any of the screens that we thought. In fact, we allow you to download up 84 different reports. So you can download individual screens, any single widgets that you have seen on the Dashboard or every single view that you have defined can be downloaded and it is downloaded in an excel spreadsheet.
[00:39:14] Michel: All right. So let’s go and have a look for example, at this particular customer. It will take on the email address, we come to the customer dashboard where we tell you the product cross sell and the customer lifetime value. So for this customer, he has ordered 3 distinct products of yours. This product, he has ordered ones for 3 units and they see these are all the financial elements of that particular order. But here on this product, he has ordered 6 times for total number of 14 units and here are all the financial details. And here is the total of the Cross-Sell of that customer which gives you the customer lifetime value. We give you the sales history and that customer has been identified as being a VIP customer. So that’s a starting point for you. Let’s go and have a look at the Refunds Manager.
[00:40:29] Michel: So this is the Manage Refunds Reimbursements. In essence, what it does is it identifies all the refunds which have happened for which Amazon has received the physical item back but they have failed to reimburse you. By clicking on the status Eligible. I’m showing you here, all the units which are in that situation. So, this account has got 786 orders for which there has been some returns that Amazon has not yet repaid that customer for. So let’s take the first 250 orders here. And let’s see how much amounts refunded to customer that has not been refunded to the seller. So that is about $2,343 that have been refunded to customer. So let’s have a look at how much has been reimbursed to the seller. For that, let’s go to the very bottom.

[00:42:10] Michel: If you will look here, a mere $28 have been refunded. Of course the customer is not commensurate to the amount reimbursed to the seller. Because for one reimbursement you can see that here, what he is reimbursable to seller is only a fraction of the cost to the buyer. But nevertheless, this guy could probably get quite a lot of money if he was using the reimbursement system. And of course we can show you how many have been completed. So for example, here you’ve got to click on this. These are the reimbursements that Amazon has automatically given to the seller. So if you look at the amounts reimbursed to the seller, you will see that some amounts have been reimbursed. Now, some have not been reimbursed at all and that is maybe because reimbursement here was for a unit that has been reimburse by the seller and not by Amazon Seller Support or Seller Central, which those are not refundable to the seller. So that is our version of Refunds Manager. Of course we give you all the returns that you have received with that disposition and the reasons for the return.
[00:43:51] Michel: So you’ve got the Customer Comments here. So the Detailed Disposition, what is sellable, damaged and customer damaged, all the customer details and customer comments as well. I just went to open this and the seal was no longer on it. So you get all the reasons why the customers have returned and likewise we gave you all the reimbursements that Amazon have already given you.
[00:44:45] Michel: So, here are all the reimbursements with all the details. Let’s go to Customer Segmentation. Let me go and show you our Settings here. We’ve got a multitude of settings. SellerLegend is very customizable. One of the things that you can customize is the Customer Segmentation. And in essence, what I have done here is for this particular Marketplace. I have chosen a threshold type. I can segment my customers by number of orders or number of units, by total profit, by customer or total revenue by customer. And here I can define up to 10 different tier names. The Tier Names are used selectable. You can call that platinum or you can call that extraordinary customer or whatever. And here we got the threshold that says, if my total revenue by customer is between zero and $20 then assign that customer to the Standard tier. If it is between $20 and $30 assigned that customer to Bronze. If it is above $50 call that customer Platinum. Now, if that customer has cause me a loss of between zero and $5, Let’s classify that as a Loss Leader. If it is between $5 and $20, let’s call that guy a Heavy Loss Leader and if it is between $20 and $1000, then something suspicious has happened here.
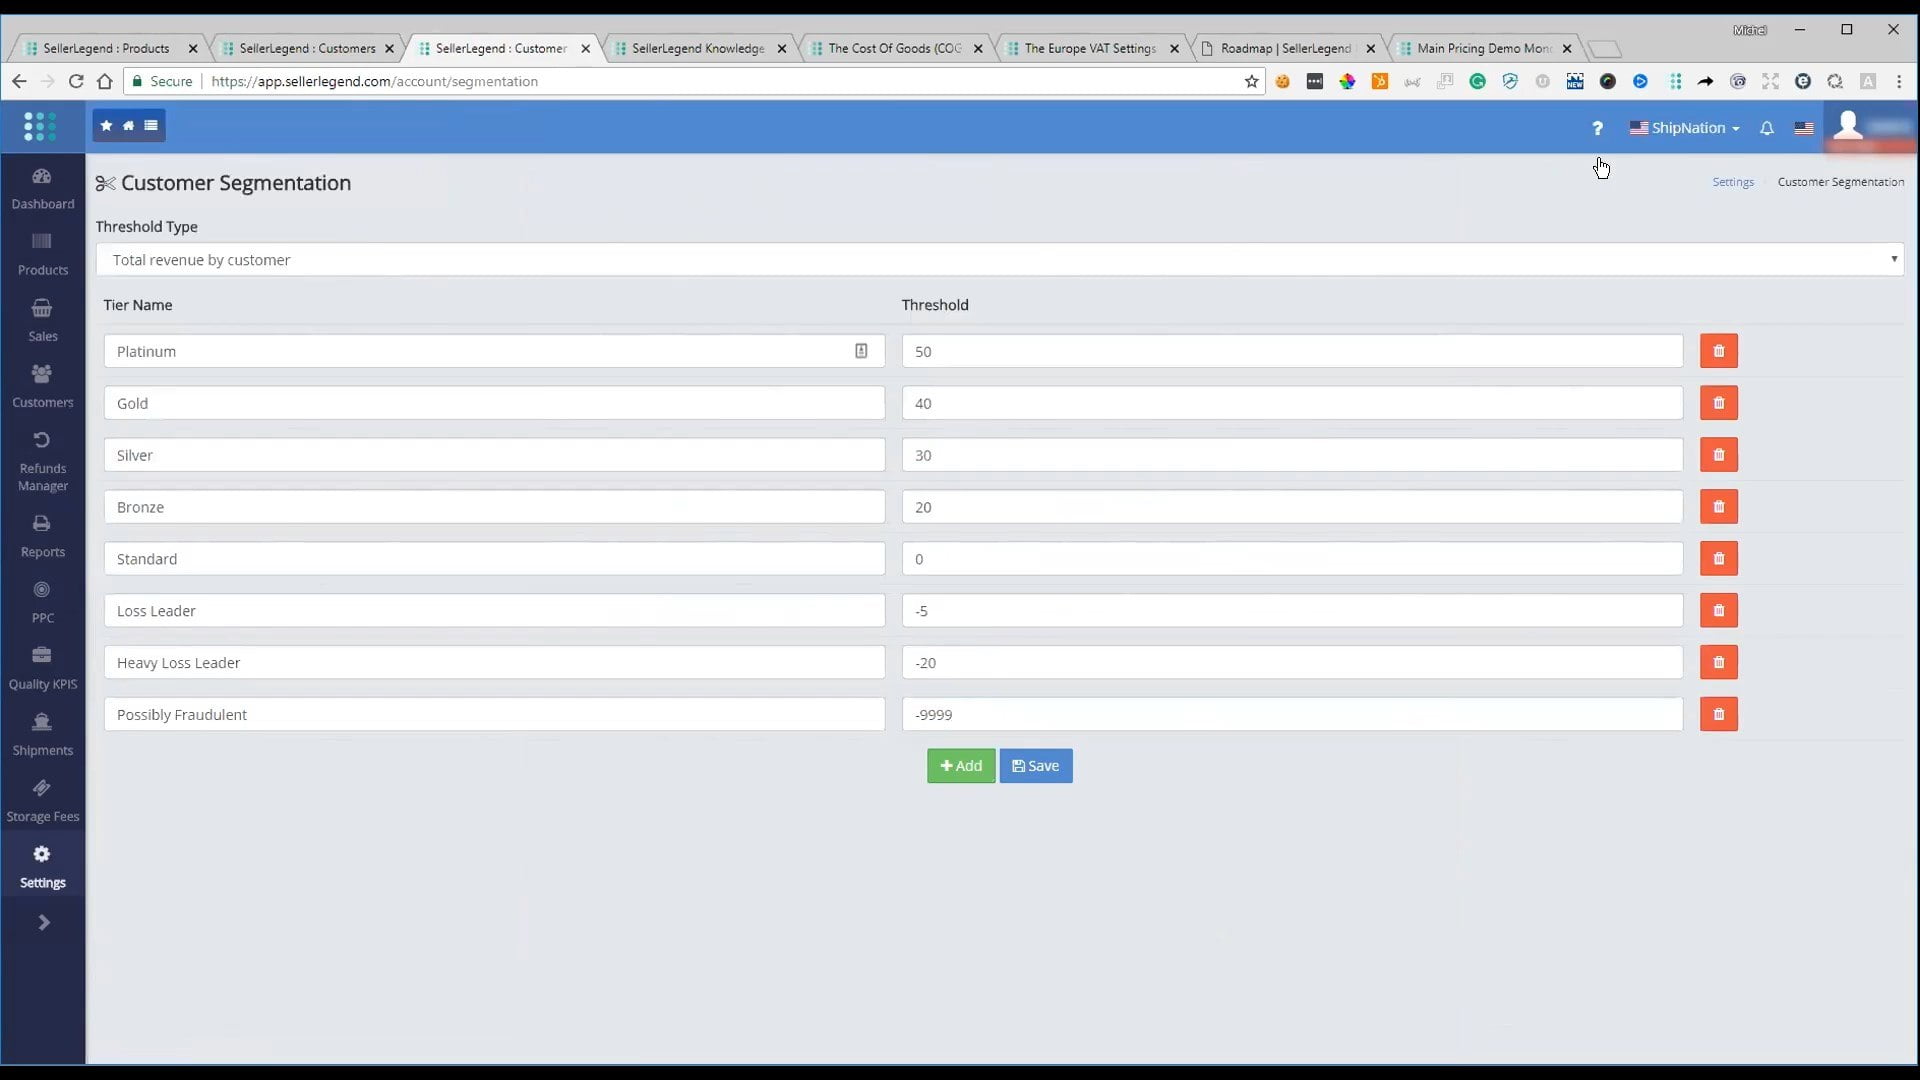
[00:46:25] Michel: Maybe it’s worth my while going to investigate that. So I’m quantifying that as Possibly Fraudulent. Let me go and show you what happens to the customer list when I have defined a such customer segmentation list. You will see that the customer is assigned a Tier Name based on the characteristics. For example, here Platinum means that customer has generated more than $50 in revenue.
[00:47:05] Michel: And if you scroll down, you will see that here is a Bronze customer and you scroll down you got a Gold customer. So this is dynamic. You can change your Customer Segmentation criteria whichever way you want and it will automatically recalculate the tier. Customer Watch Listing, I mentioned to you that you could assign a customer to a watch list. For example, this customer here, which was defined as a VIP, that is because he is a Platinum customer with 7 orders, so I have arbitrarily decided to classify that customer as a VIP. So whenever that customer now reorders from me, I will get a notification that says that VIP customer call such and such as reorder from you. So then might advise you to then go and give the customer maybe a further discount or handle the customer differently depending on what characteristics you want to assign to VIP customers.
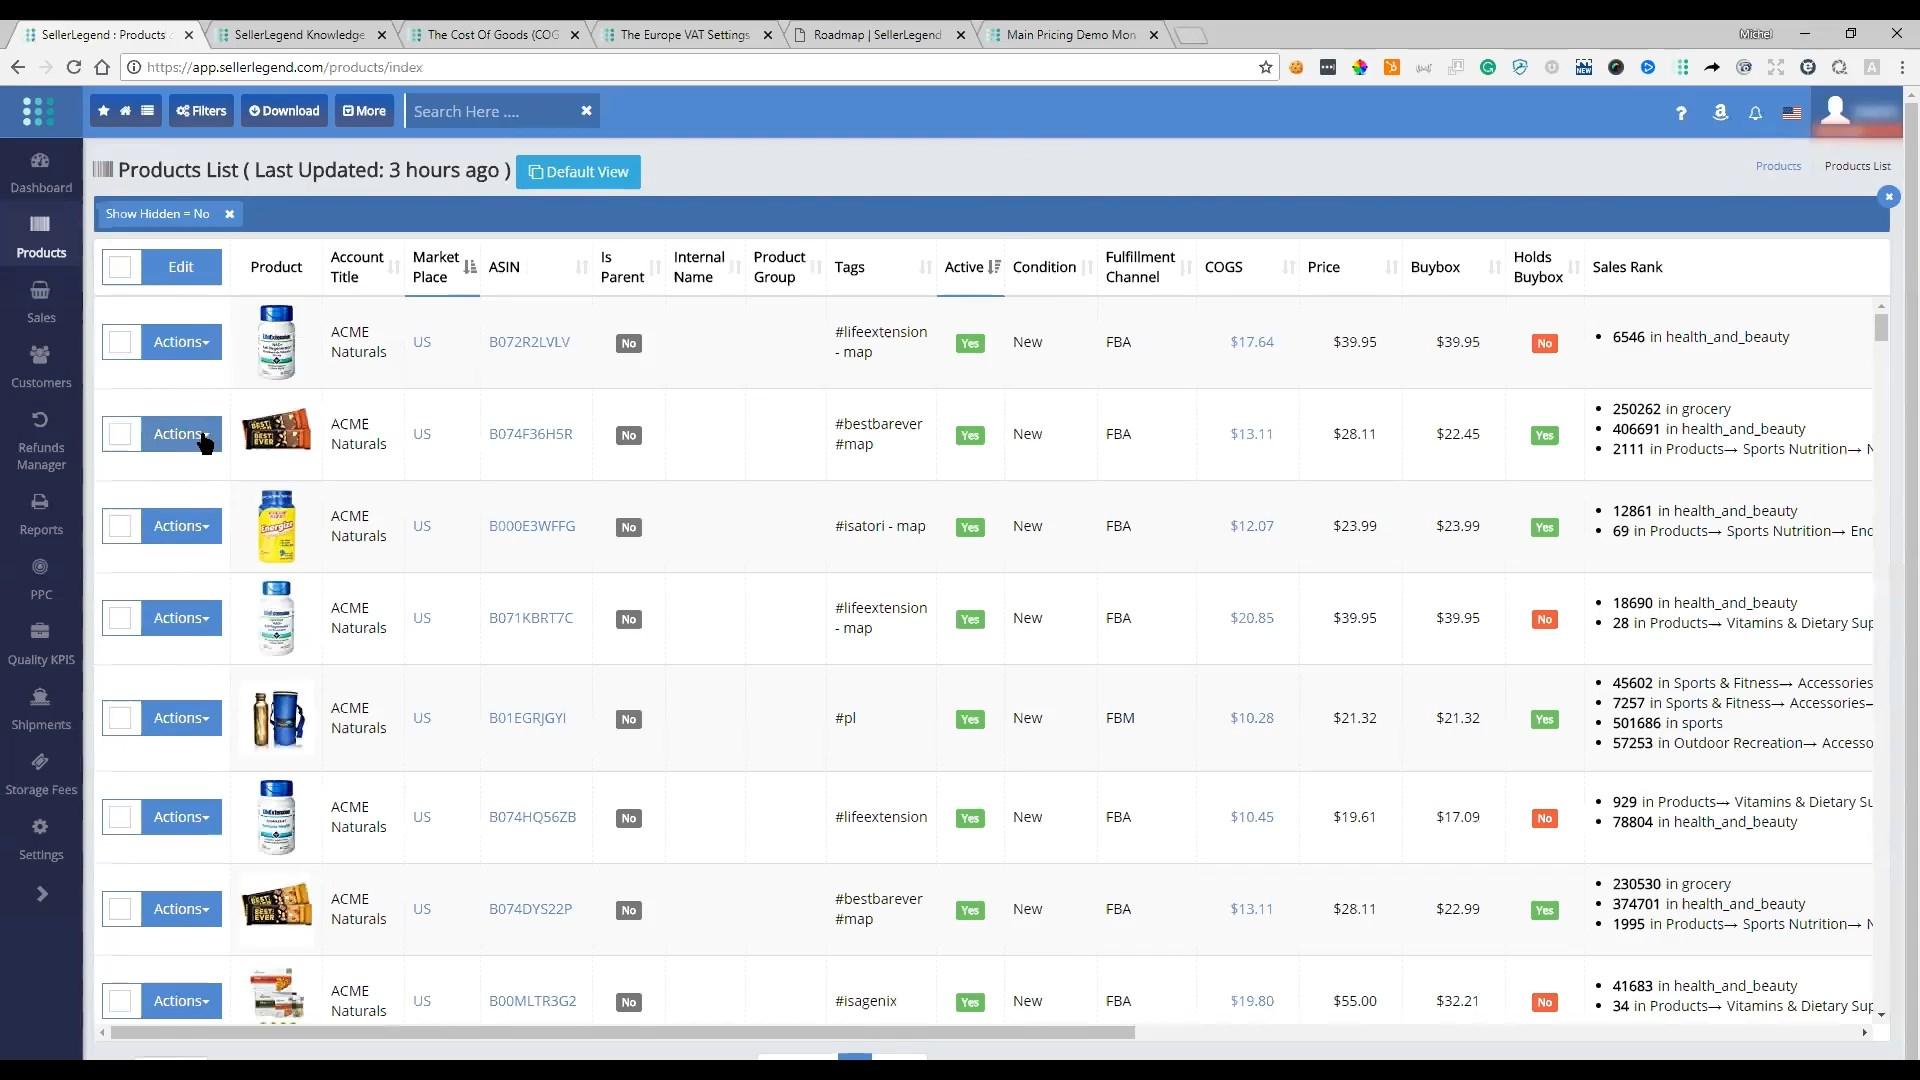
[00:48:38] Michel: So that’s Customer Watch Listing for you. Now let’s go and talk about three additional features and we’ll call it a day. I could go on and on and on. I am trying to squeeze everything into 45 minutes. I think I’m failing in that. So I’m just going to quickly talk about COGS, about VAT and about Guest Accounts. Let me go and show you what COGS looks like. Let’s go and have a look at Product List. And for each product you can assign a Cost of Goods of course. And for example here the Cost of Goods is $17.64. So let’s go and have a look at what that cost of goods looks like. That’s a cost of goods that applies to the period between the 5th of February 2015 to the 5th of February of 2021, so about 3 years in the past and 3 years in the future. And that says that for any orders received between that period of time, we will assign that $17.64 as cost of goods to that order.
[00:50:03] Michel: And that $17.64 is simply constituted by the cost of Manufacturing, the Providers and the Total paid is $17.64 for one unit which amounts to $17.64. We can enter a Total Paid for let’s say 200 units and it will calculate the amount per unit. Not only that, but you can define as many cost elements as you want. So for example, you could add an additional cost element, for example, shipping. Let’s say the total paid was .25 per unit and I add another cost element and I will call that for example, Inserts. And let’s say that I paid $300 USD for let’s say 600 units. So when you click away from that, it says it’s .50c per unit and you will see that now the total cost of goods has increased to $1839.
[00:51:38] Michel: So you can add as many cost elements as you want and you can define where that cost element belongs to. Not only can you define cost elements, but you can define additional Cost Periods. So you can say for a period which has automatically calculated that the next available date would be the 6th of February, 2021 because my previous Cost Periods ended on the 5th February 2021, you can enter completely different cost element here, for example, let’s delete that one and let’s add another cost element that says Product prep charges for example.
[00:52:45] Michel: And that would be let’s say .15 per unit. Let me save those changes. And now you see is I have got two cost periods. One cost period for $18.29 and one cost period for $18.39. And this cost period will be applied to all the orders that come from the 6th of February, 2021 to the 6th of February, 2024. So if I want to to have these cost periods side by side, for example, today is the 17th, so I can end this to the 17th of July and start this on the 18th of July. And now these ones are back to back. So from the 5th of February, 2015 to the 17th of July, 2017. Any order between those two dates will be assigned $18.39 as cost of goods. And from tomorrow up until 2024, the cost of goods will be different. It will be $18.29. So you can have as many cost periods as you want, within the cost period, as many cost elements as you want. And you’ve got an indication of the history of your cost of goods.
[00:54:27] Michel: So that’s cost of goods for you. Let’s go and have a look at European VAT. That is in settings and I can’t show it in this account because it’s an American account. Let me show you VAT, but I can’t do this on this account because it’s a US account. Let me show you that in a screenprint. And essentially what we do, for any period we allow you to define any percentage. For example, you could start SellerLegend and don’t be VAT registered. So therefore, up until your date of registration, your VAT percentage would be zero. But let’s assume that you would then start to be VAT registered, but you have got a nonstandard rate of VAT. For example, the period between the 11th of October, 2016 to November 2017, we got a nonstandard VAT percentage, you can enter that VAT rate here, and let’s say that eventually you grow up and you become a fully fledged VAT registered company you can then say at that point in time, 7th of November 2017, my VAT rate is 20%.
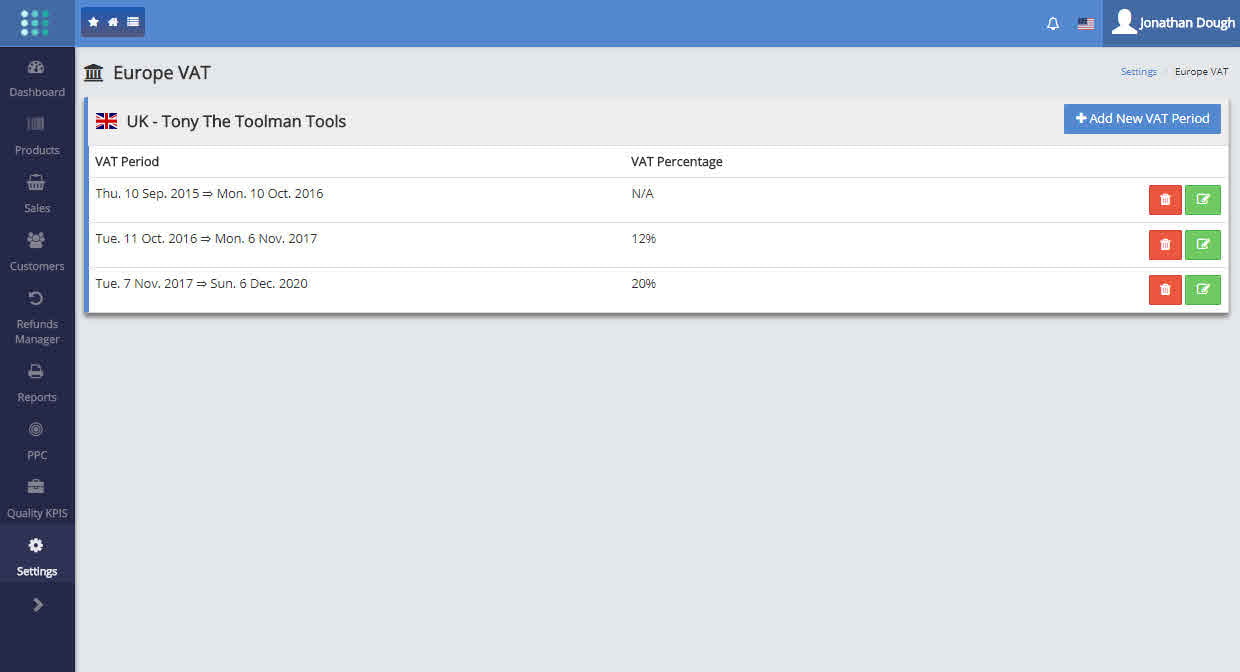
[00:56:04] Michel: So you could decide to enter a VAT rate for a period and change the VAT rate according to your requirements. Now, not only can you do that at the level of the marketplace, you can do that at the level of each individual product. So you’ve got great flexibility there. Finally, let me go and show you Guest Accounts. And Guest Accounts I can go back to this account. Guest Accounts is in settings. And here it is for any specific account. So here we are only addressing ShipNation. You can define as many users as you want to give access to and for each user, you can restrict what they can or cannot see. So for example, for this user, you can restrict it to only see ShipNation. And within ShipNation you can decide which are the features that you don’t want that user to see.
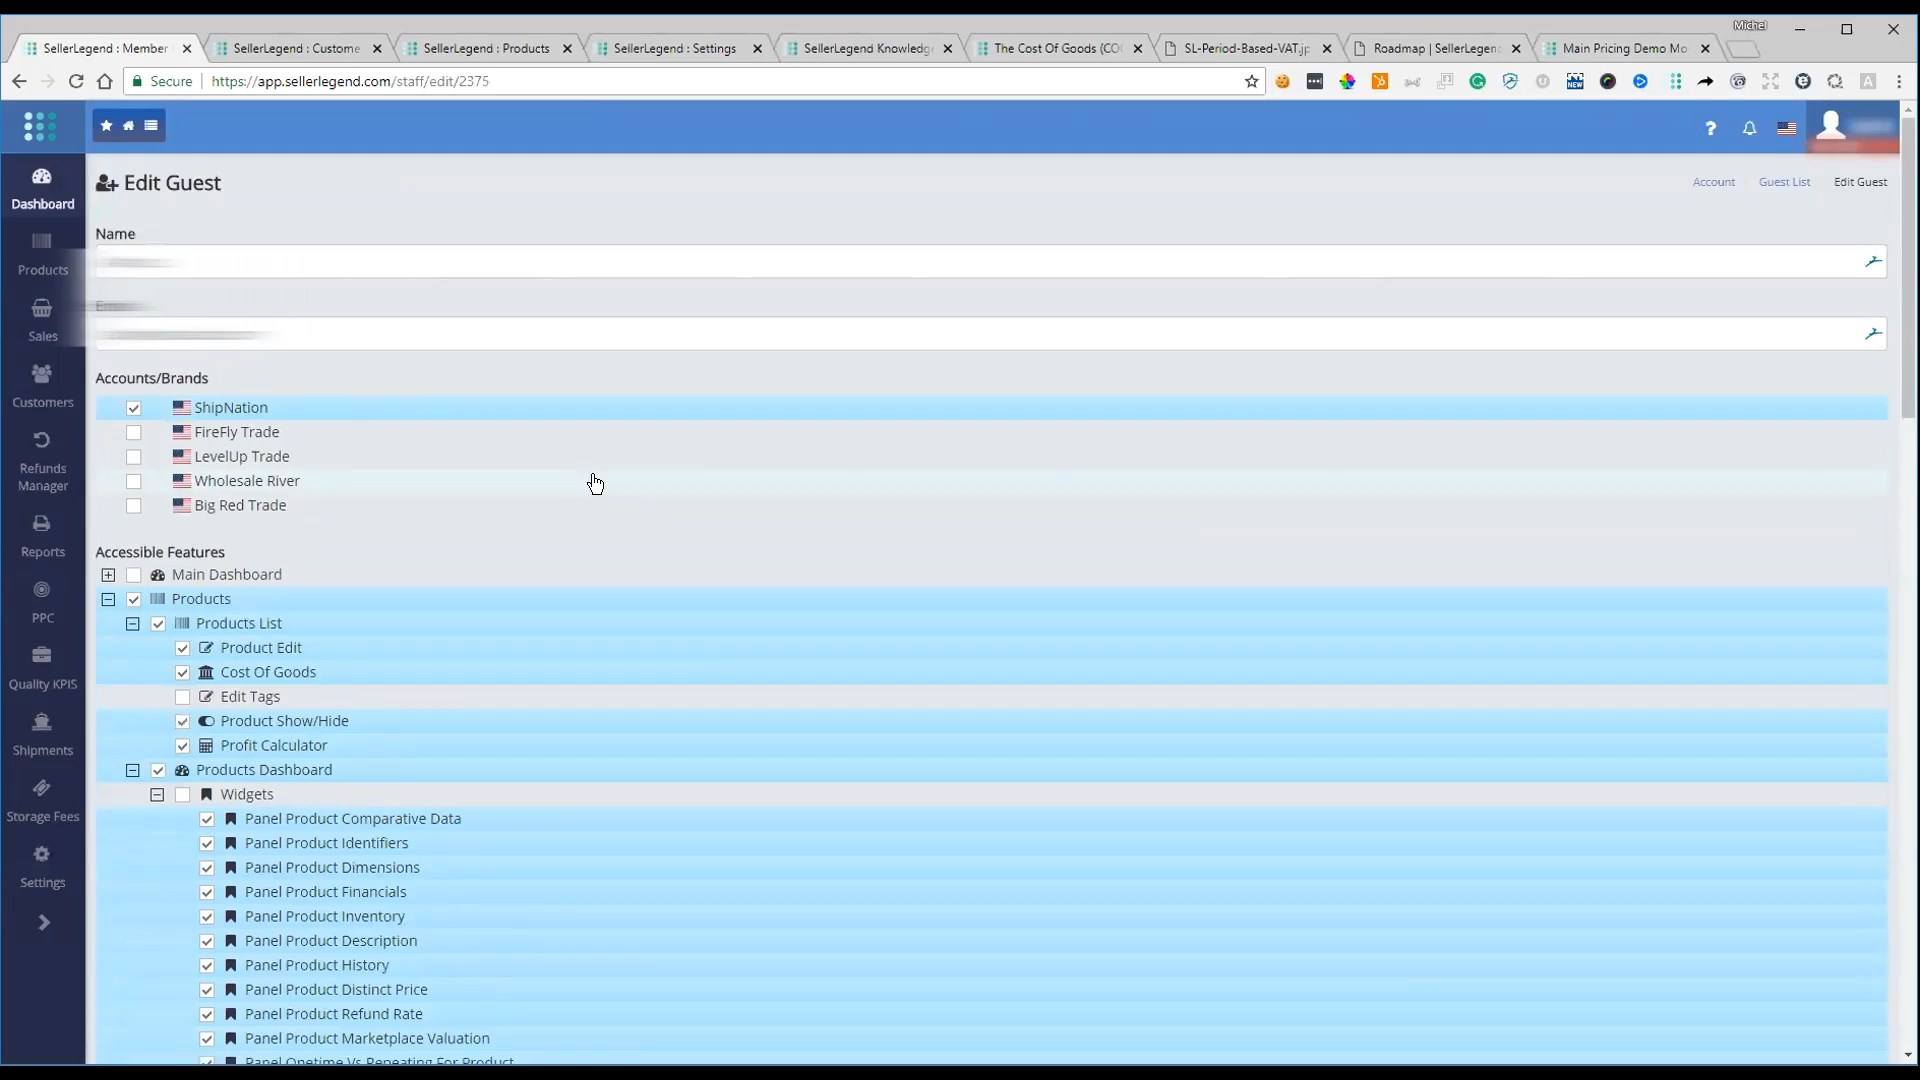
[00:57:27] Michel: So for example, you could deny that user to view Profit and Loss report or you could deny it to see any Customer List. So by unticking the particular function, you deny that customer the view of that particular function. So you can assign as many sub-accounts as you want. You can assign as many features as you want and you can decline as many features as you want. Now the next step for us is going to be to allow you to select a specific view of a specific screen. And at that point in time, that will essentially give you the ability to have limit the view of individual fields in individual screens. Okay. So I think that’s enough. You probably are bored by now. I am sorry that I sped through this at 100 miles an hour, but I wanted to show you the essentials. There is a great deal more that is in this platform. It’s great fun to use, you can use that left, right and center. There are lots of things that you can do with customer lists. You can generate customer lists for Facebook. You can generate customer lists for cross-selling, for custom marketing. But we unfortunately do not have enough time to go through that detail here and now. Augustas, I am done. Thank you very much for the time.
[00:59:25] Augustas: Thank you too. And since we are still on the screen, can we go through the pricing?
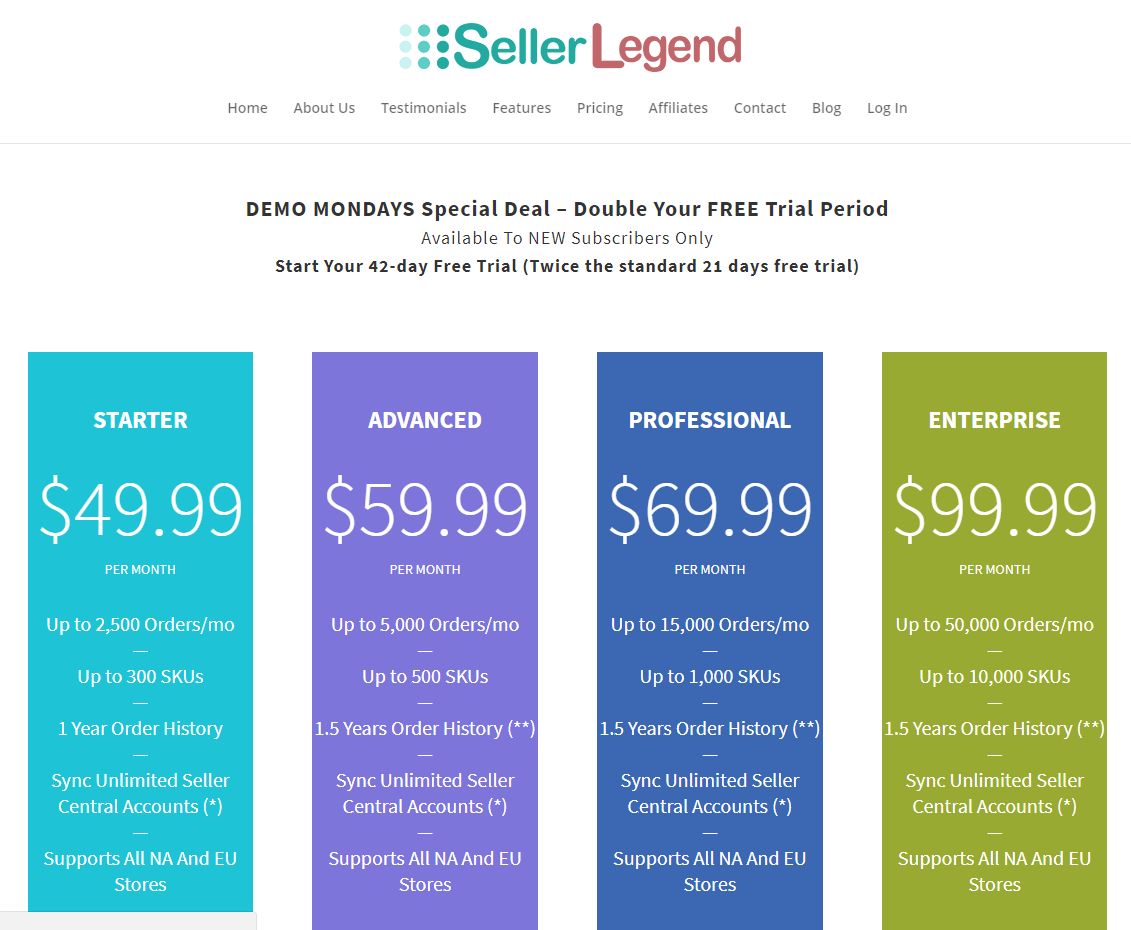
[00:59:28] Michel: Yes, we certainly can. It is a standard pricing, I’m afraid. But for Demo Mondays, we give you double the free trial period. Now the pricing is segmented based on the number of orders that you got and the number of SKUs that you got. In terms of SKUs, were talking about active SKUs. Users that have got tens of thousands of SKUs, but they only have got maybe 3 or 400 SKUs that are active. That is the number of SKUs that we look at to determine the tier where you belong. So we’ve got Starter, Advanced, Professional and Enterprise. And it depends on the number of orders. 2,500 orders up to 5,000 up to 15,000 and up to 50,000 orders.
[01:00:47] Augustas: All right. So it means if I have two SKUs and I have let’s say 20,000 orders. I have to go for the highest tier?
[01:00:54] Michel: You will have to go here, yes. Okay. But can have as many accounts as you want. So unlimited SellerCentral accounts. However, there is a little caveat here. And the caveat is that Fair Use Policy applies, all SellerCentral accounts must belong to the same seller. The reason for that is to avoid the situation where an agency, with 20, 30, 40 accounts, that are customers accounts, would come into SellerLegend and put all these customer accounts in one SellerLegend account and only be required to pay for one license fee. So if you’re an agency, you definitely can utilize SellerLegend, but talk to us. We will make you a deal.
[01:01:52] Augustas: Few final questions. So already we have seen the offer for Demo Mondays viewers. It’s perfect. So instead of 21 days, people can have a trial for 42 days and two more questions. What features you are planning to release in the near future for your users?
[01:02:15] Michel: Okay. Can we go back to screen sharing. So here is our Development Roadmap and you see this compartmentalize in about three months per three months. We are actually drip feeding the new developments. So for example, July and August 2018, the Seller Feedback Report, but the time that this segment is aired, it will already be there. So you will be able to see all the feedback that you have received from your sellers. Likewise, probably by the 30th of July, which is the date at which the segment is going to be aired you’re likely to already have the Inbound Non-compliance Report, the Fancy Image Uploader for product Thumbnails is already there. Date Formats to respect user’s Locale is probably going to be in August. Configurable ROI formula, believe it or not different people have got different ways of calculating return on investment.
[01:03:26] Michel: It gives us a headache in Support because some people tell us your ROI formula is incorrect. We fixed that to satisfy their requirements. And then another segment of the population tells us your ROI formula is incorrect. So we’re going to be allowing you to configure how to calculate your ROI. Two Factor Authentication is one that we’re very keen to implement because of GDPR. So that’s probably going to come in August. Shipping Costs for FBM orders in August. Elevating other Amazon fees to the dashboard. and also customizable is in August as well. Improved taxes handling in PL report, that might already be there by the 30th. PPC Headline Ads, that’s going to be in August as well. Graphical view of Sessions and Performance data, August. Main chart annotations that is already there. I have not had the opportunity to demonstrate that to you.
[01:04:26] Michel: Custom Type Table views that is already there. Add Australia and Japan marketplaces. Australia is already there. But it’s only accessible for those who have joined the Beta testing of it. Japan is going to be in August. So September-November, common inventory across all EU marketplaces, Shipments, Warehouses and Internal Shipments in third party warehouses. So we will allow you to have multiple warehouses and it will be able to move stock from warehouse to the other warehouse. Multi-currency costs of goods. ASIN based cost of goods, in other words, you would only enter one cost of goods for the parent SKU and all variation with that cost of goods. Considering Warehouse Inbounds in Reorder Calculation, again, that will be customizable. For the order for the moment, we are not considering the Inbounds in reorder calculation because those may not be sellable. But we are going to be allowing you to do that automatically based on customization that you will be able to apply, which is essentially what it says here. The Out of stock Calendar, Out of stock Consideration in Reorder Calculation, which we do not do know ans is a major failure of ours. I am not afraid of saying that. We should have develop that in our first version of inventory, but we didn’t.
[01:06:18] Michel: And the Ability to define Custom Columns in tables, that’s what I was mentioning to you. Where you will be able to define your own columns in any table where you will be able to enter any data you want and you will be able to do calculations on your custom columns as well. In November we will introduce Purchase Orders and Suppliers. We will revamp notifications and add more notifications. I haven’t had the chance of showing you notifications at all, but we’ve got seller rates and notifications that we are notifying you about. Offer all the implemented notifications as Zapier triggers, which is something that a lot of our users are requesting. Offer Sales Statistics, PL Report, Dashboards in unified currency for all the accounts.
[01:07:15] Michel: You will be able to define any ISO currency and define that currency as your bookkeeping currency and we will then recalculate all the amounts in that bookkeeping currency and we’ll be able to tell you in any currency how much profit you’re making, how much revenue you’re making and so forth. In February to April, Long-term storage Fees. We’ve got Richard that will assist you in managing your long-term storage fees. We will start offering APIs so that you can get data out of a SellerLegend into your own applications. We will introduce webhooks and we will be providing Rules-based PPC with automated bidding and automated keyword management. For the moment, we only give you financials, we only give you performance. We give you keywords and search terms, but we do not give you automated bidding nor automated keyword management. So that’s what’s going to happen in between now and April 2019.
[01:08:38] Augustas: Perfect. Thank you. So now I guess we can stop sharing. And the last question. How do users and potential users could reach out to your support team?
[01:09:00] Michel: It’s easy. In all our screens, we got the Support button and we use intercom, which is probably the favorite way of submitting tickets. It is very quickly becoming an industry standards. So you can reach us either via the Support button or you can reach us by sending us an email to support@sellerlegend.com.
[01:09:27] Augustas: Thank you very much, Michel. It was a pleasure to feature SellerLegend and good luck in your business. Bye Bye.
[01:09:35] Michel: Bye. Thank you very much for your time.